> ## Documentation Index
> Fetch the complete documentation index at: https://docs.gurubase.ai/llms.txt
> Use this file to discover all available pages before exploring further.
# Analytics
> Learn how to analyze the usage of your Guru.
Gurubase provides a comprehensive usage analytics dashboard to help you understand how your Guru is being used. Track what questions are being asked, how your Guru is performing, and gain insights into user behavior and engagement patterns.
## Accessing the Usage Analytics
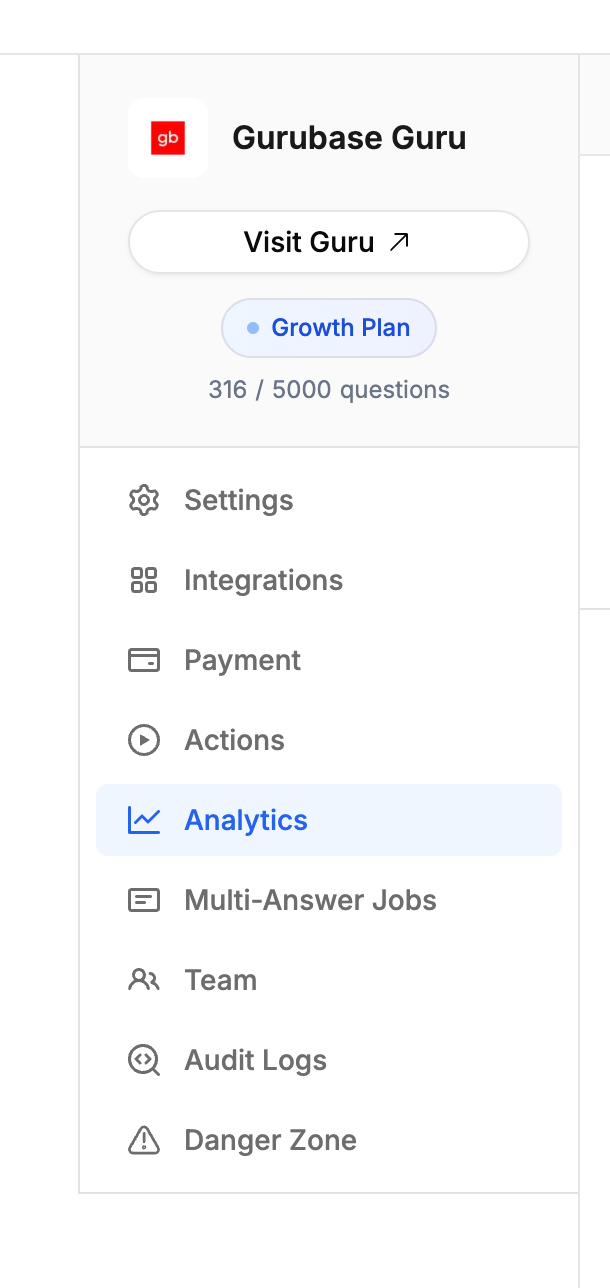
To access the usage analytics, go to the Guru's detail page and click on the "Analytics" tab.
 ## Usage Analytics Dashboard
The usage analytics dashboard provides a detailed overview of your Guru's usage with comprehensive metrics and visualizations. All sections are synchronized and respond to the filters and date range you select.
### Date Range and Filters
At the top of the dashboard, you can select a date range using predefined options (Today, Yesterday, 7D, 30D, 3M, 6M, 12M) or choose a custom date range.
## Usage Analytics Dashboard
The usage analytics dashboard provides a detailed overview of your Guru's usage with comprehensive metrics and visualizations. All sections are synchronized and respond to the filters and date range you select.
### Date Range and Filters
At the top of the dashboard, you can select a date range using predefined options (Today, Yesterday, 7D, 30D, 3M, 6M, 12M) or choose a custom date range.
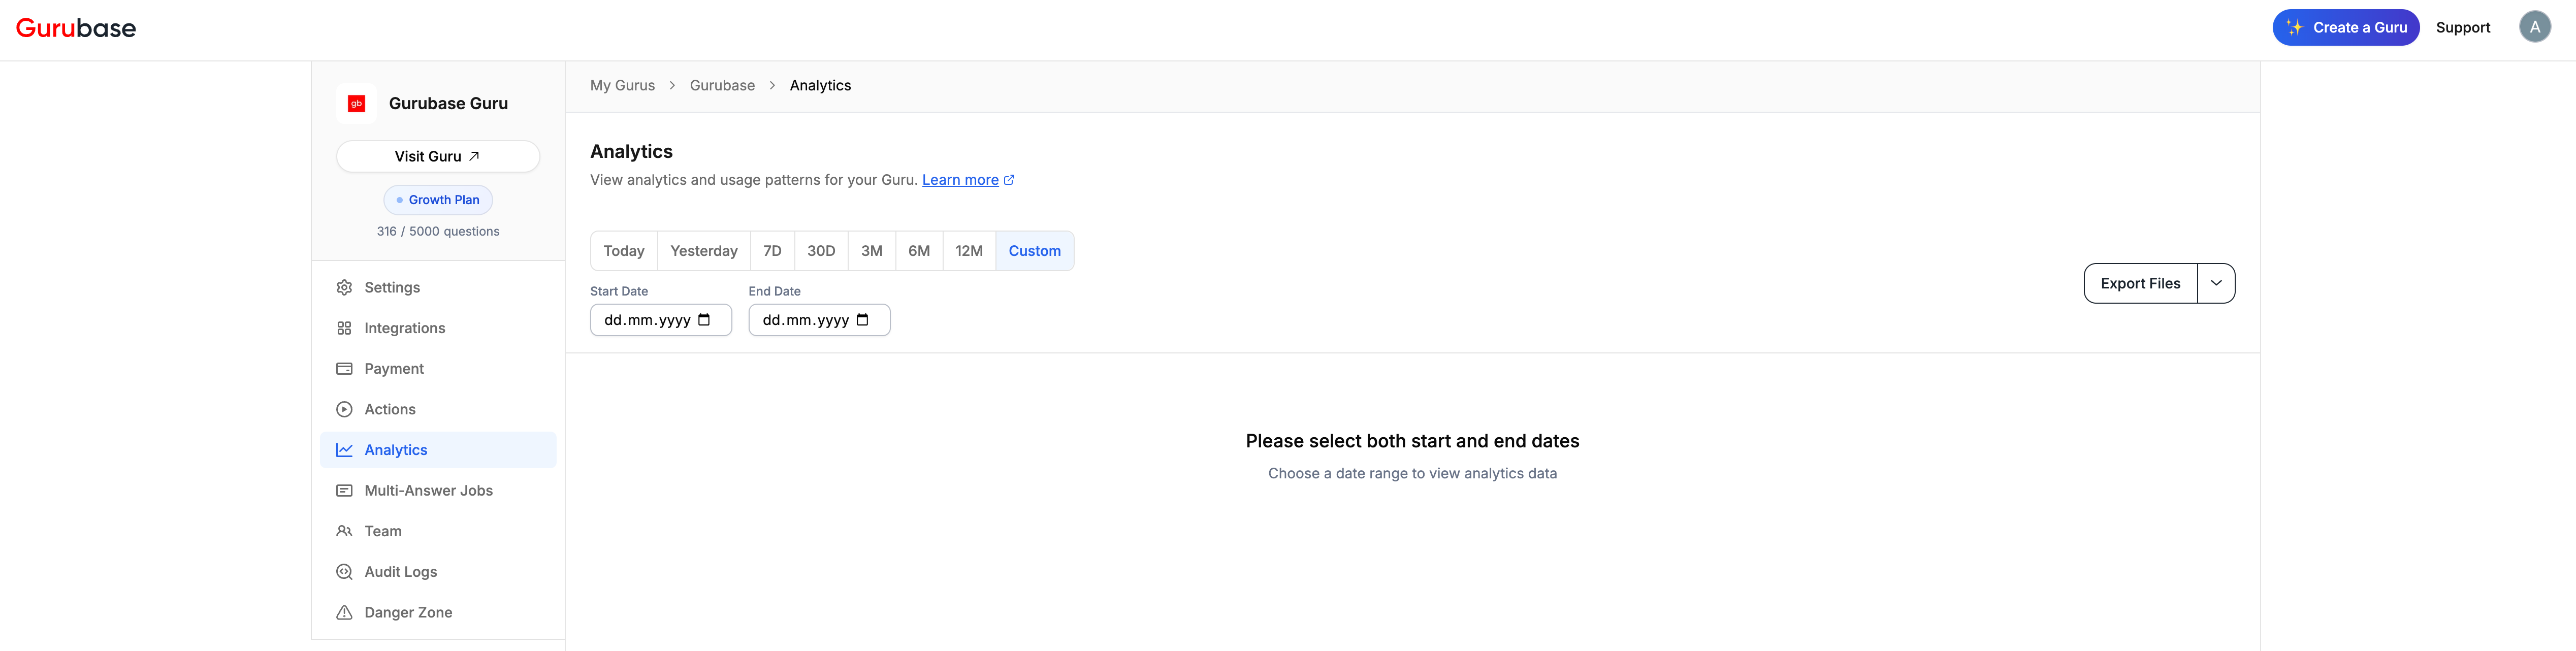 The dashboard also includes page-wide filters that apply to all sections:
 * **User**: Filter by specific users
* **Intent**: Filter by user intent. The following intent types are available:
* **Short Answer**: User wants a brief, concise answer
* **Explanation**: User wants detailed explanation of a concept
* **How To**: User wants step-by-step instructions
* **Why**: User wants to understand reasons or causes
* **Comparison**: User wants to compare different options
* **Clarification**: User needs clarification on something unclear
* **Greeting**: User is greeting or starting conversation
* **Thanks**: User is expressing gratitude
* **Troubleshooting**: User is trying to solve a problem
* **Information Request**: User wants specific information
* **Other**: Any other intent not covered above
* **Sentiment**: Filter by sentiment. The following sentiment types are available:
* **Positive**
* **Neutral**
* **Negative**
* **Topics**: Filter by topic tags
* **Vote**: Filter by vote status (Upvote, Downvote, No Vote)
* **Edit Answer**: Filter by edited answers
* **Source**: Filter by source type (Slack, Discord, GitHub, Widget, API, Gurubase UI, Zendesk, etc.)
* **Country**: Filter by country
All filters work together to provide a comprehensive view of your Guru's performance across different dimensions.
### Key Metrics
* **User**: Filter by specific users
* **Intent**: Filter by user intent. The following intent types are available:
* **Short Answer**: User wants a brief, concise answer
* **Explanation**: User wants detailed explanation of a concept
* **How To**: User wants step-by-step instructions
* **Why**: User wants to understand reasons or causes
* **Comparison**: User wants to compare different options
* **Clarification**: User needs clarification on something unclear
* **Greeting**: User is greeting or starting conversation
* **Thanks**: User is expressing gratitude
* **Troubleshooting**: User is trying to solve a problem
* **Information Request**: User wants specific information
* **Other**: Any other intent not covered above
* **Sentiment**: Filter by sentiment. The following sentiment types are available:
* **Positive**
* **Neutral**
* **Negative**
* **Topics**: Filter by topic tags
* **Vote**: Filter by vote status (Upvote, Downvote, No Vote)
* **Edit Answer**: Filter by edited answers
* **Source**: Filter by source type (Slack, Discord, GitHub, Widget, API, Gurubase UI, Zendesk, etc.)
* **Country**: Filter by country
All filters work together to provide a comprehensive view of your Guru's performance across different dimensions.
### Key Metrics
 The dashboard stat cards display six key metrics at a glance:
* **Total Questions**: Total number of questions asked
* **Out of Context Questions**: Questions that couldn't be answered
* **Referenced Data Sources**: Number of unique data sources used
* **Average Response Time**: Average time taken to generate answers
* **Answer Ratio**: Percentage of questions that received answers
* **Average Binge Length**: Average number of questions per user session
Each metric shows percentage changes compared to the previous period, helping you track trends over time.
## Dashboard Sections
Below are the sections available in the usage analytics dashboard, organized in the order they appear:
### 1. Questions Section
The dashboard stat cards display six key metrics at a glance:
* **Total Questions**: Total number of questions asked
* **Out of Context Questions**: Questions that couldn't be answered
* **Referenced Data Sources**: Number of unique data sources used
* **Average Response Time**: Average time taken to generate answers
* **Answer Ratio**: Percentage of questions that received answers
* **Average Binge Length**: Average number of questions per user session
Each metric shows percentage changes compared to the previous period, helping you track trends over time.
## Dashboard Sections
Below are the sections available in the usage analytics dashboard, organized in the order they appear:
### 1. Questions Section
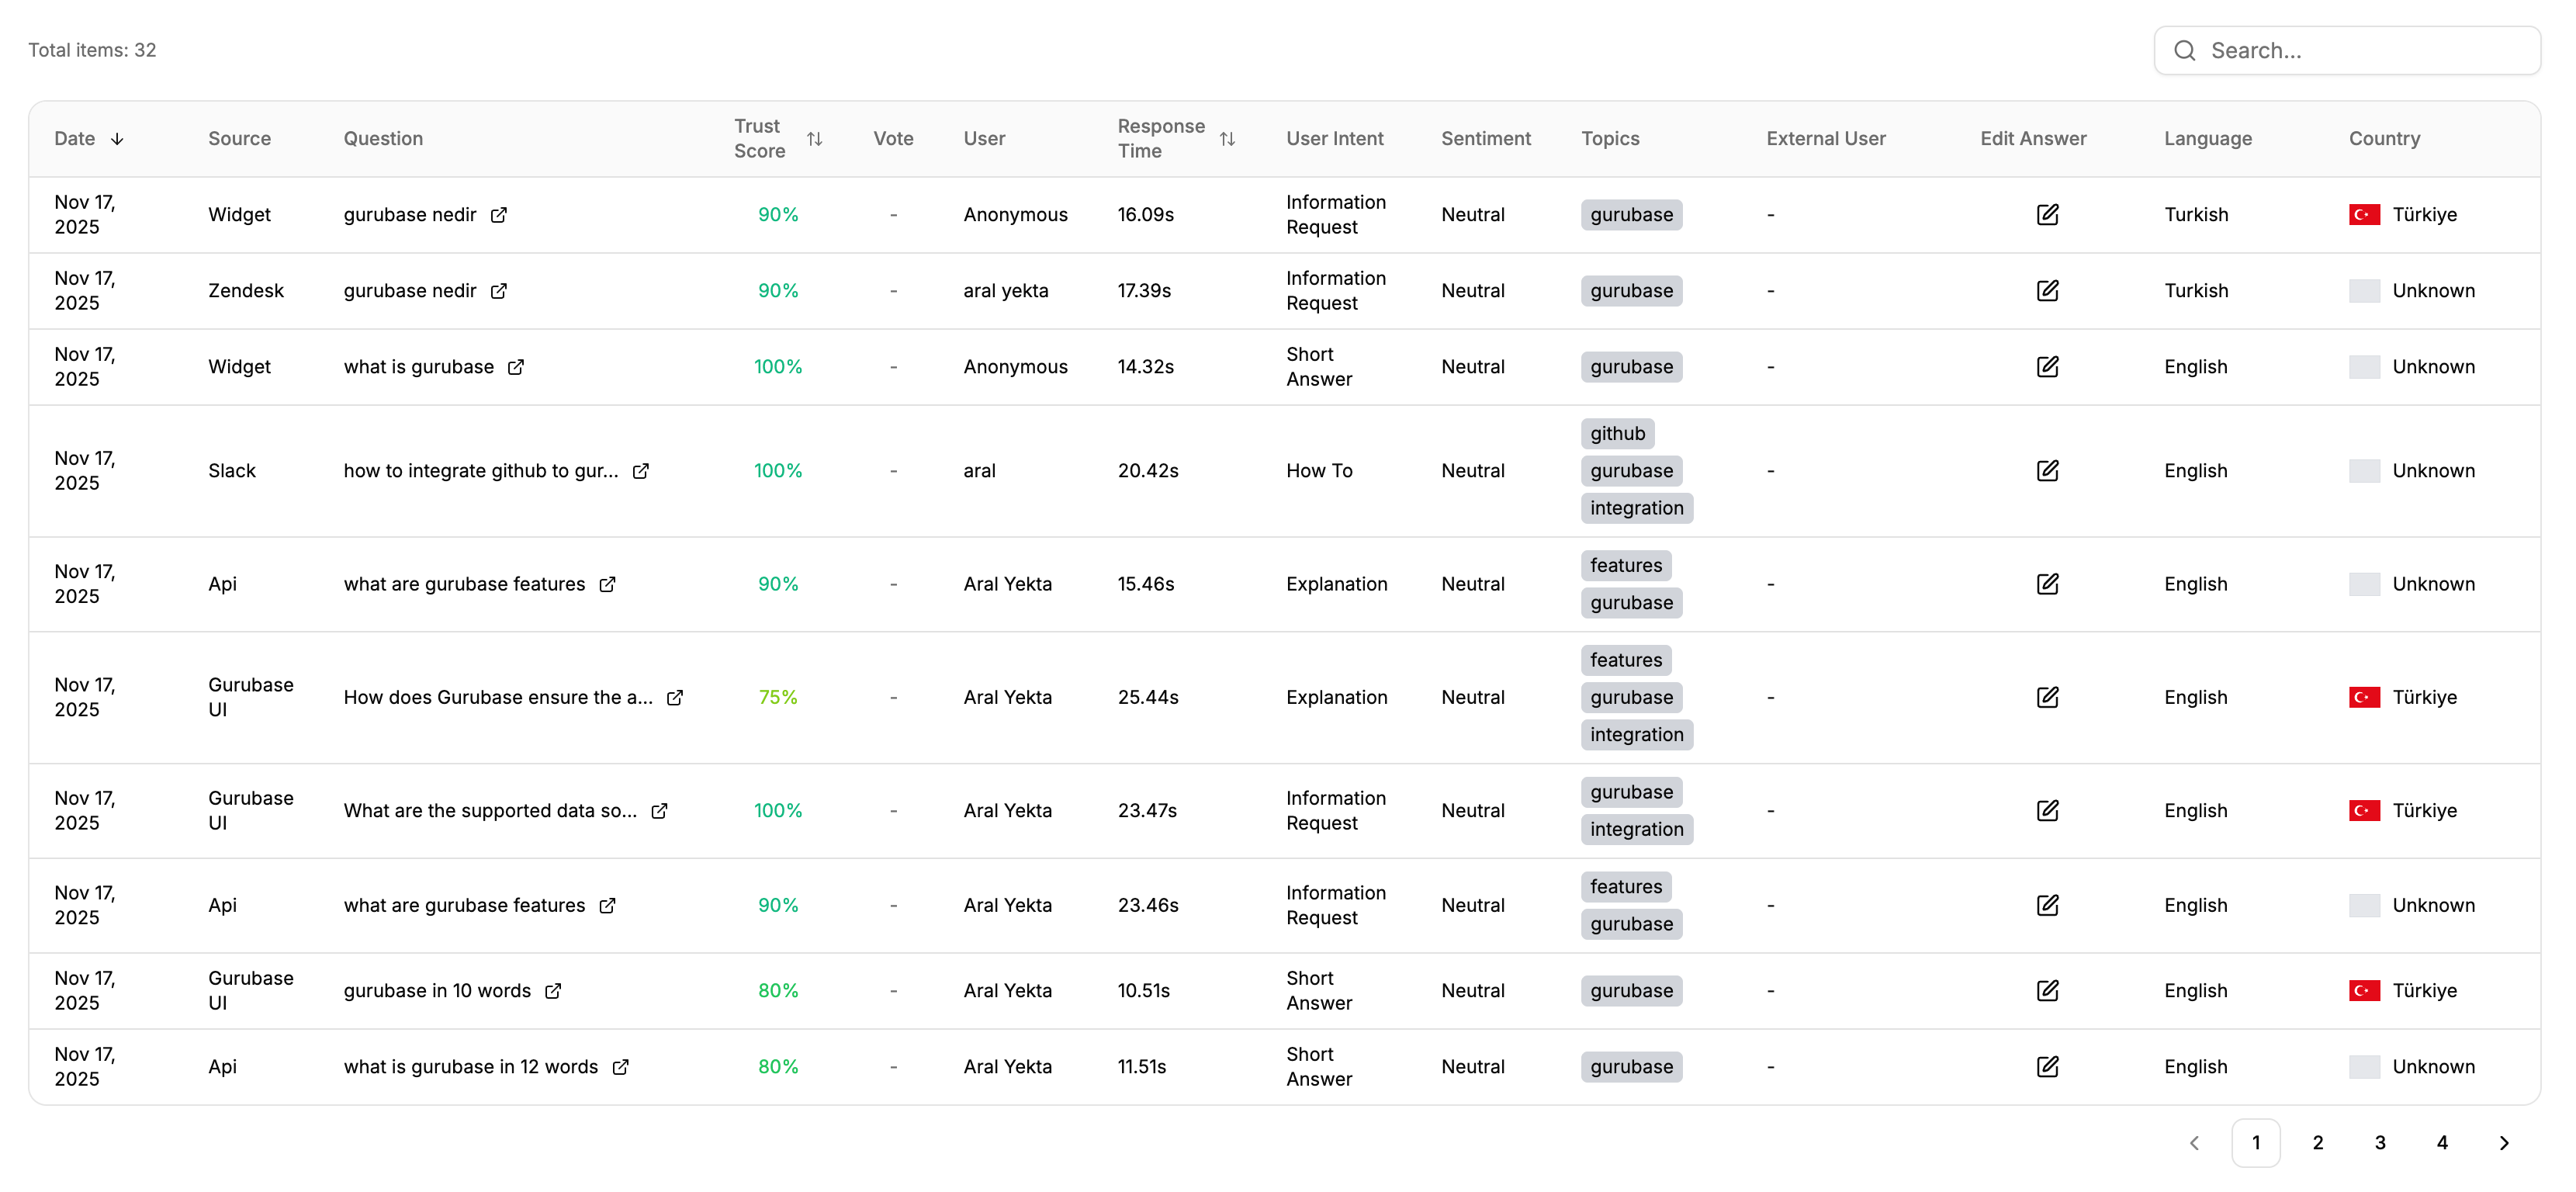
 The questions section shows all questions that have been asked to your Guru over time. You can view detailed information including:
* Question text with clickable links
* Trust score (confidence level of the answer)
* Vote status (upvote, downvote, or no vote)
* User who asked the question
* Response time
* User intent classification
* Sentiment analysis
* Topics extracted from the question
* Language and country information
The questions section shows all questions that have been asked to your Guru over time. You can view detailed information including:
* Question text with clickable links
* Trust score (confidence level of the answer)
* Vote status (upvote, downvote, or no vote)
* User who asked the question
* Response time
* User intent classification
* Sentiment analysis
* Topics extracted from the question
* Language and country information
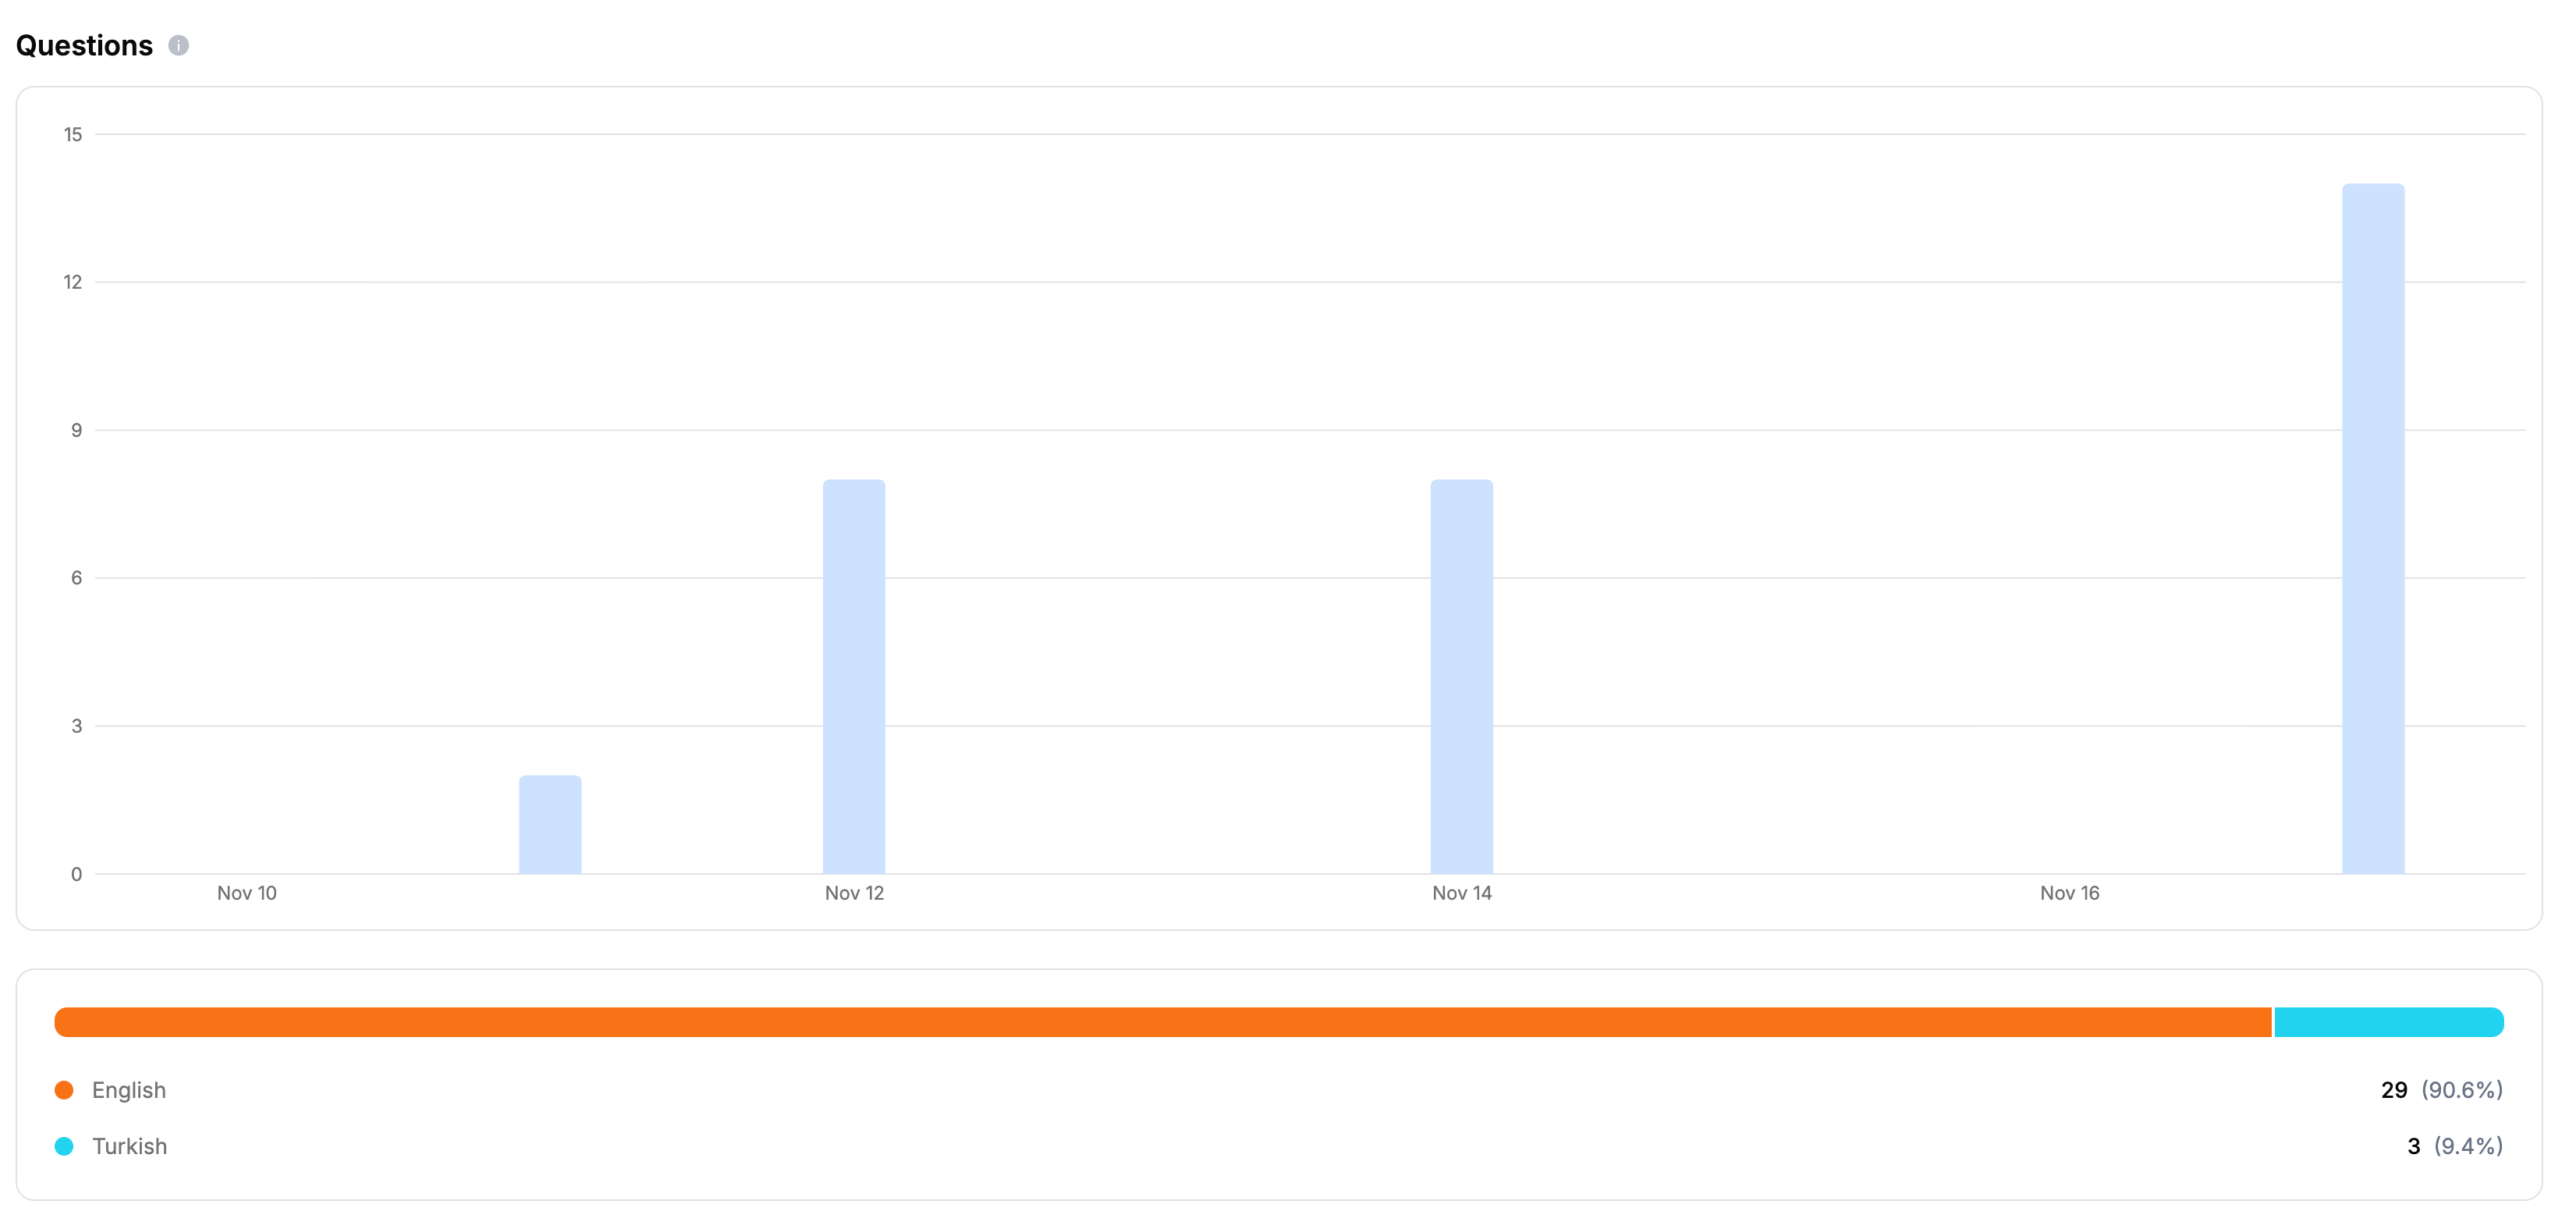
 You can search questions by text, sort by various columns, and filter using the page-wide filters. The section also includes a bar chart showing question frequency over time.
### 2. Unable to Answer Section
You can search questions by text, sort by various columns, and filter using the page-wide filters. The section also includes a bar chart showing question frequency over time.
### 2. Unable to Answer Section
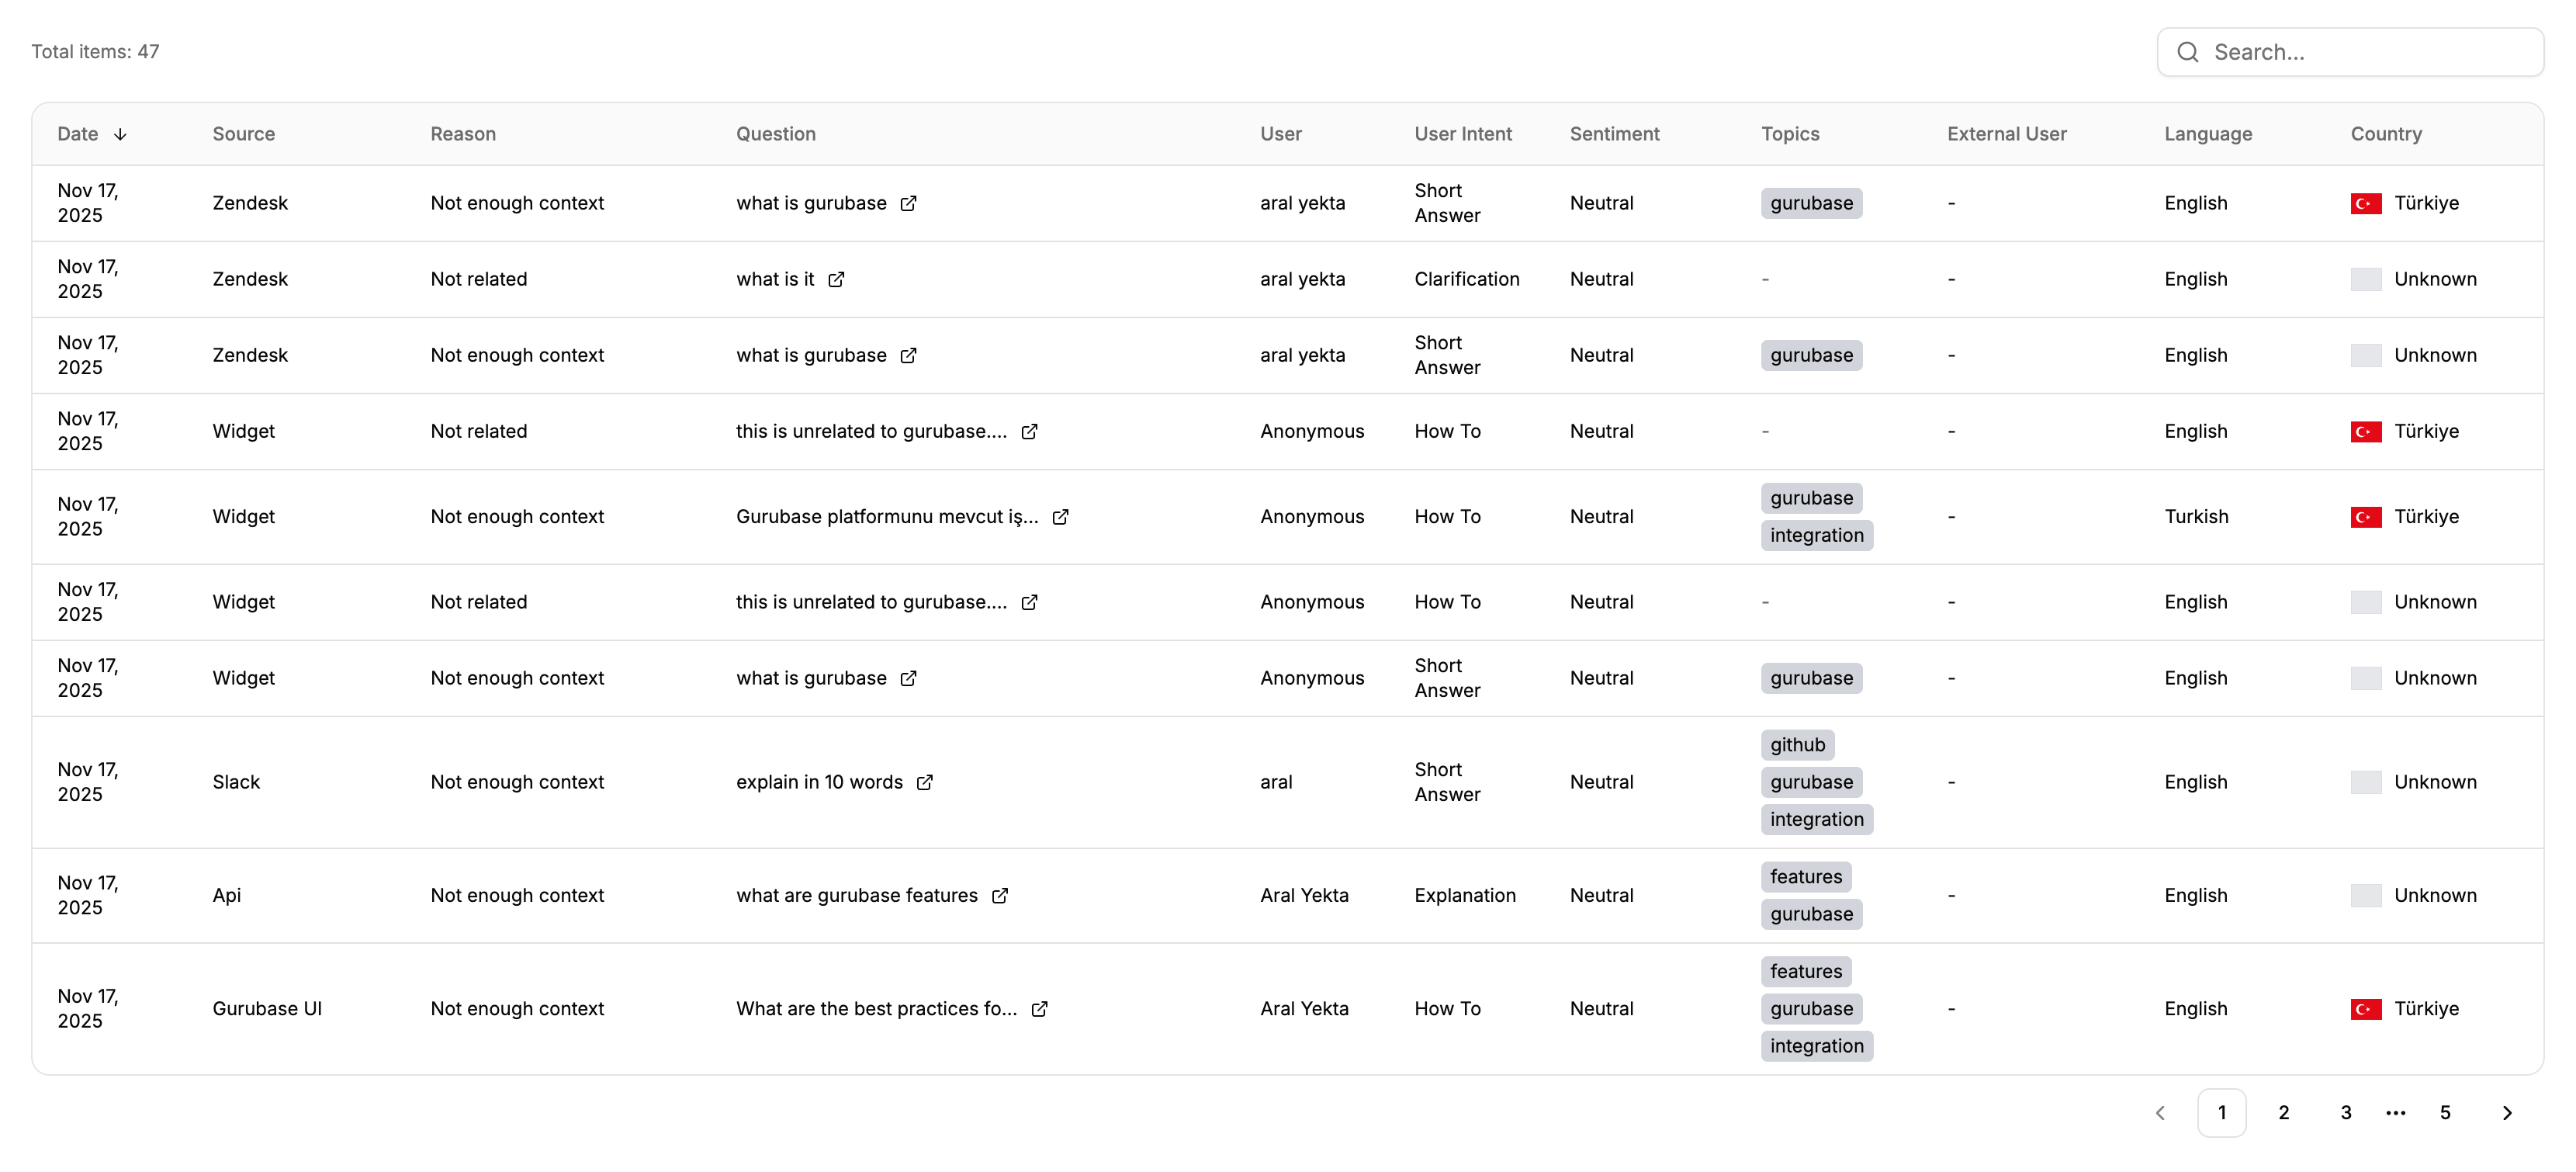
 The unable to answer section shows questions that your Guru was unable to answer. Each entry includes:
* The reason why the question couldn't be answered (e.g., "Not enough context", "Not related")
* Source, user, intent, sentiment, topics, language, and country information
The unable to answer section shows questions that your Guru was unable to answer. Each entry includes:
* The reason why the question couldn't be answered (e.g., "Not enough context", "Not related")
* Source, user, intent, sentiment, topics, language, and country information
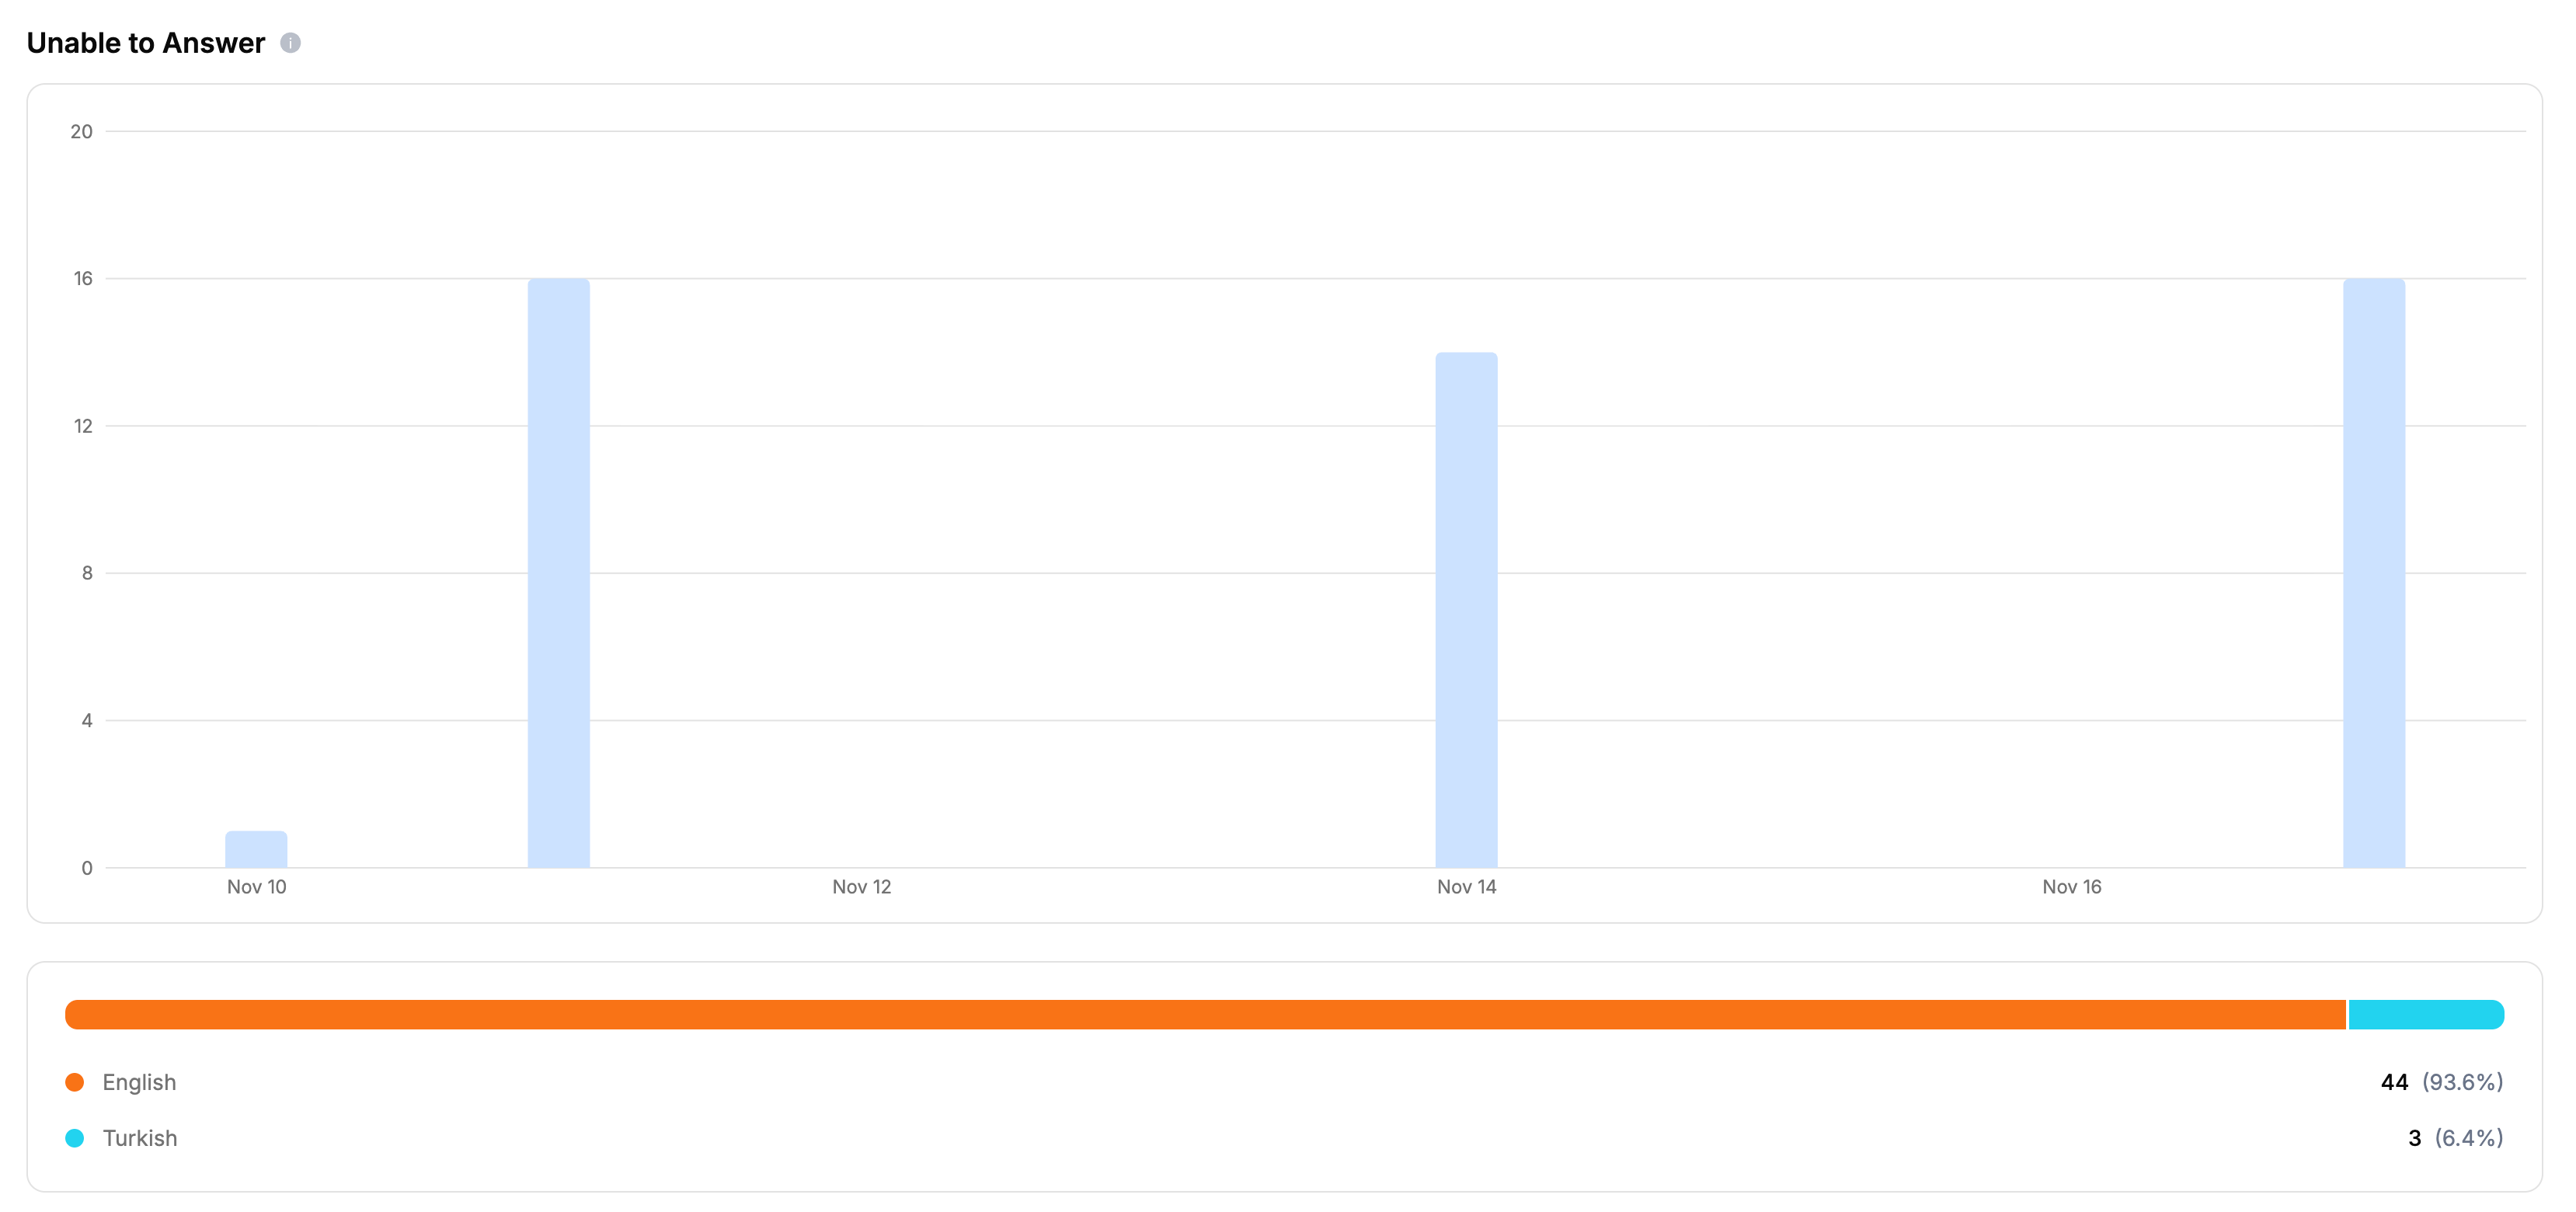
 This section includes a bar chart showing the frequency of unanswered questions over time and a language distribution chart. This provides valuable insight into whether your data sources are sufficient for your users. You can improve your data sources and reindex them to enable your Guru to answer more questions.
### 3. Referenced Data Sources Section
This section includes a bar chart showing the frequency of unanswered questions over time and a language distribution chart. This provides valuable insight into whether your data sources are sufficient for your users. You can improve your data sources and reindex them to enable your Guru to answer more questions.
### 3. Referenced Data Sources Section
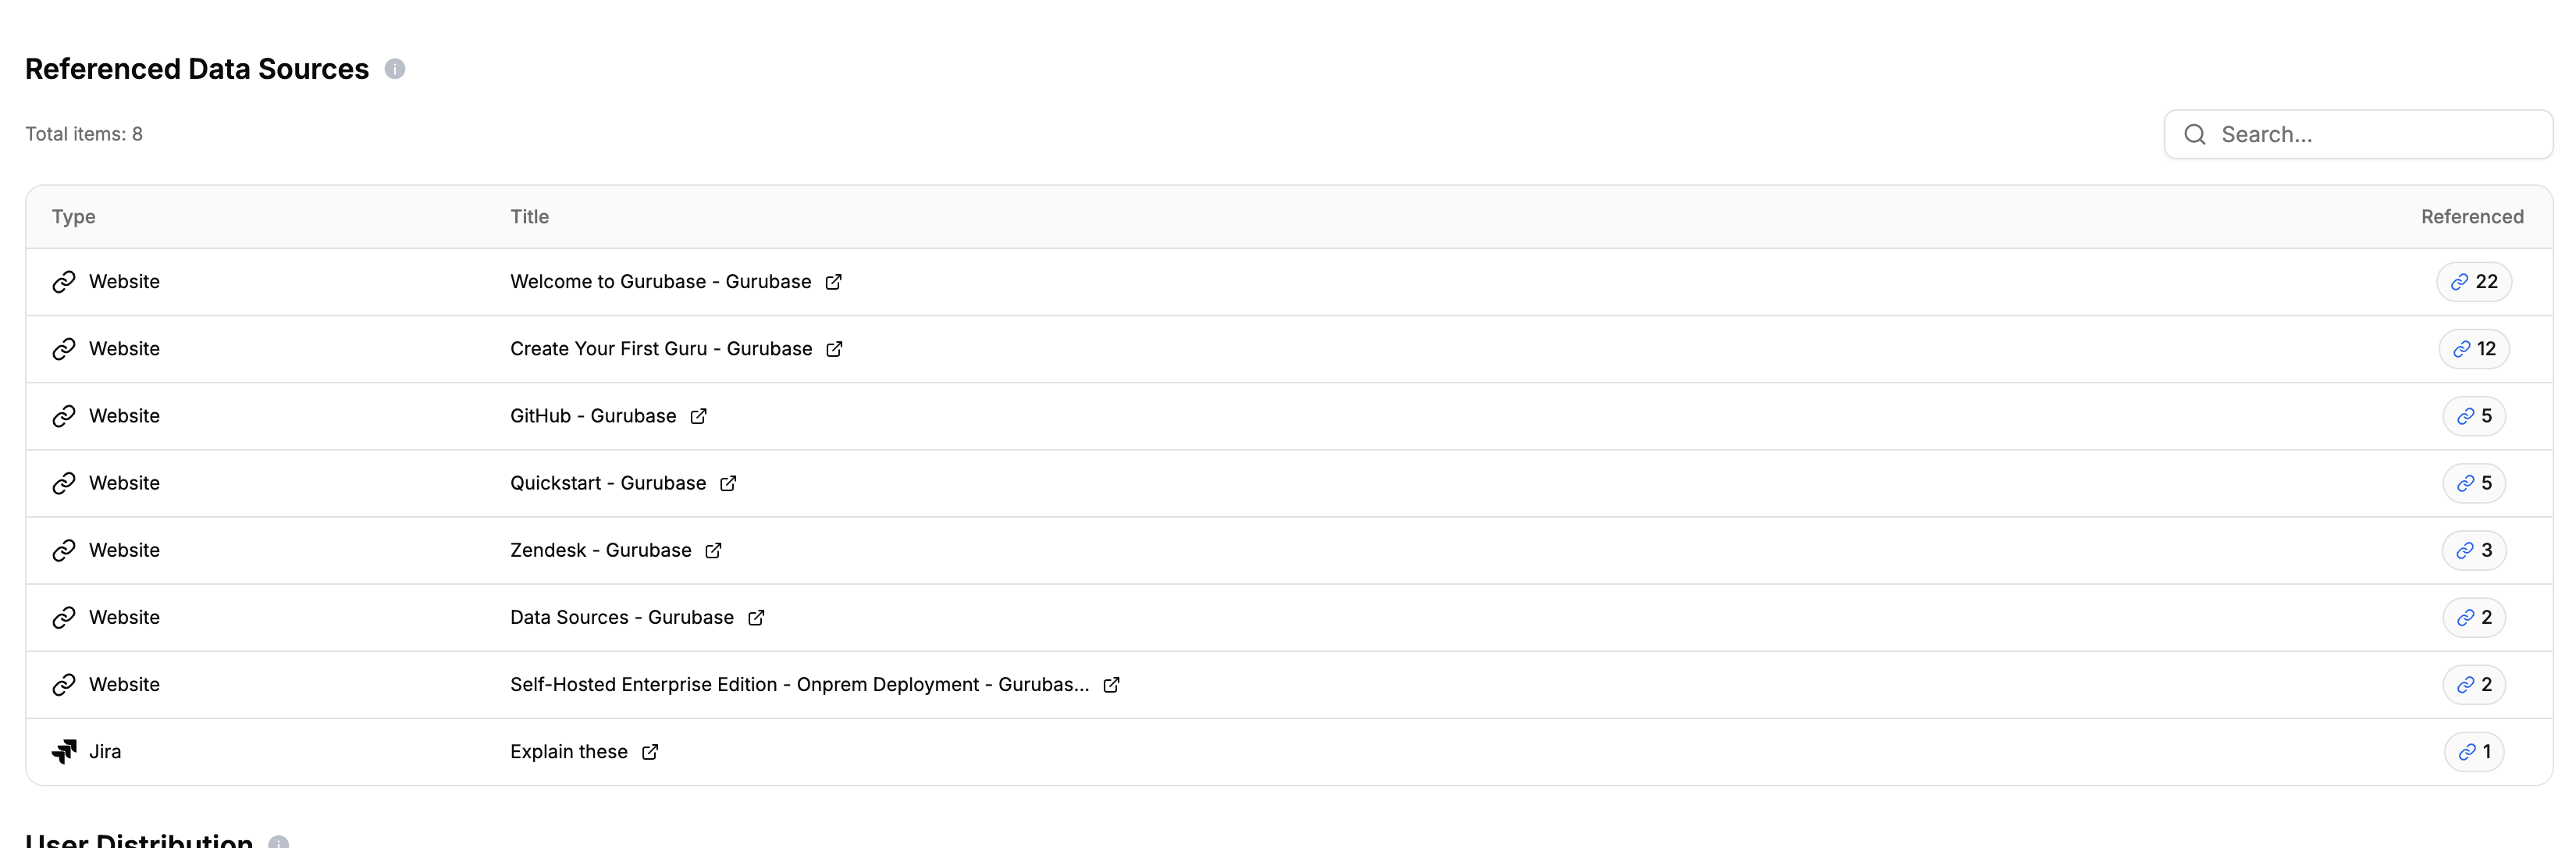 The referenced data sources section shows the data sources that your Guru has used to answer questions. The "Referenced" column shows the number of times each data source has been referenced to answer questions.
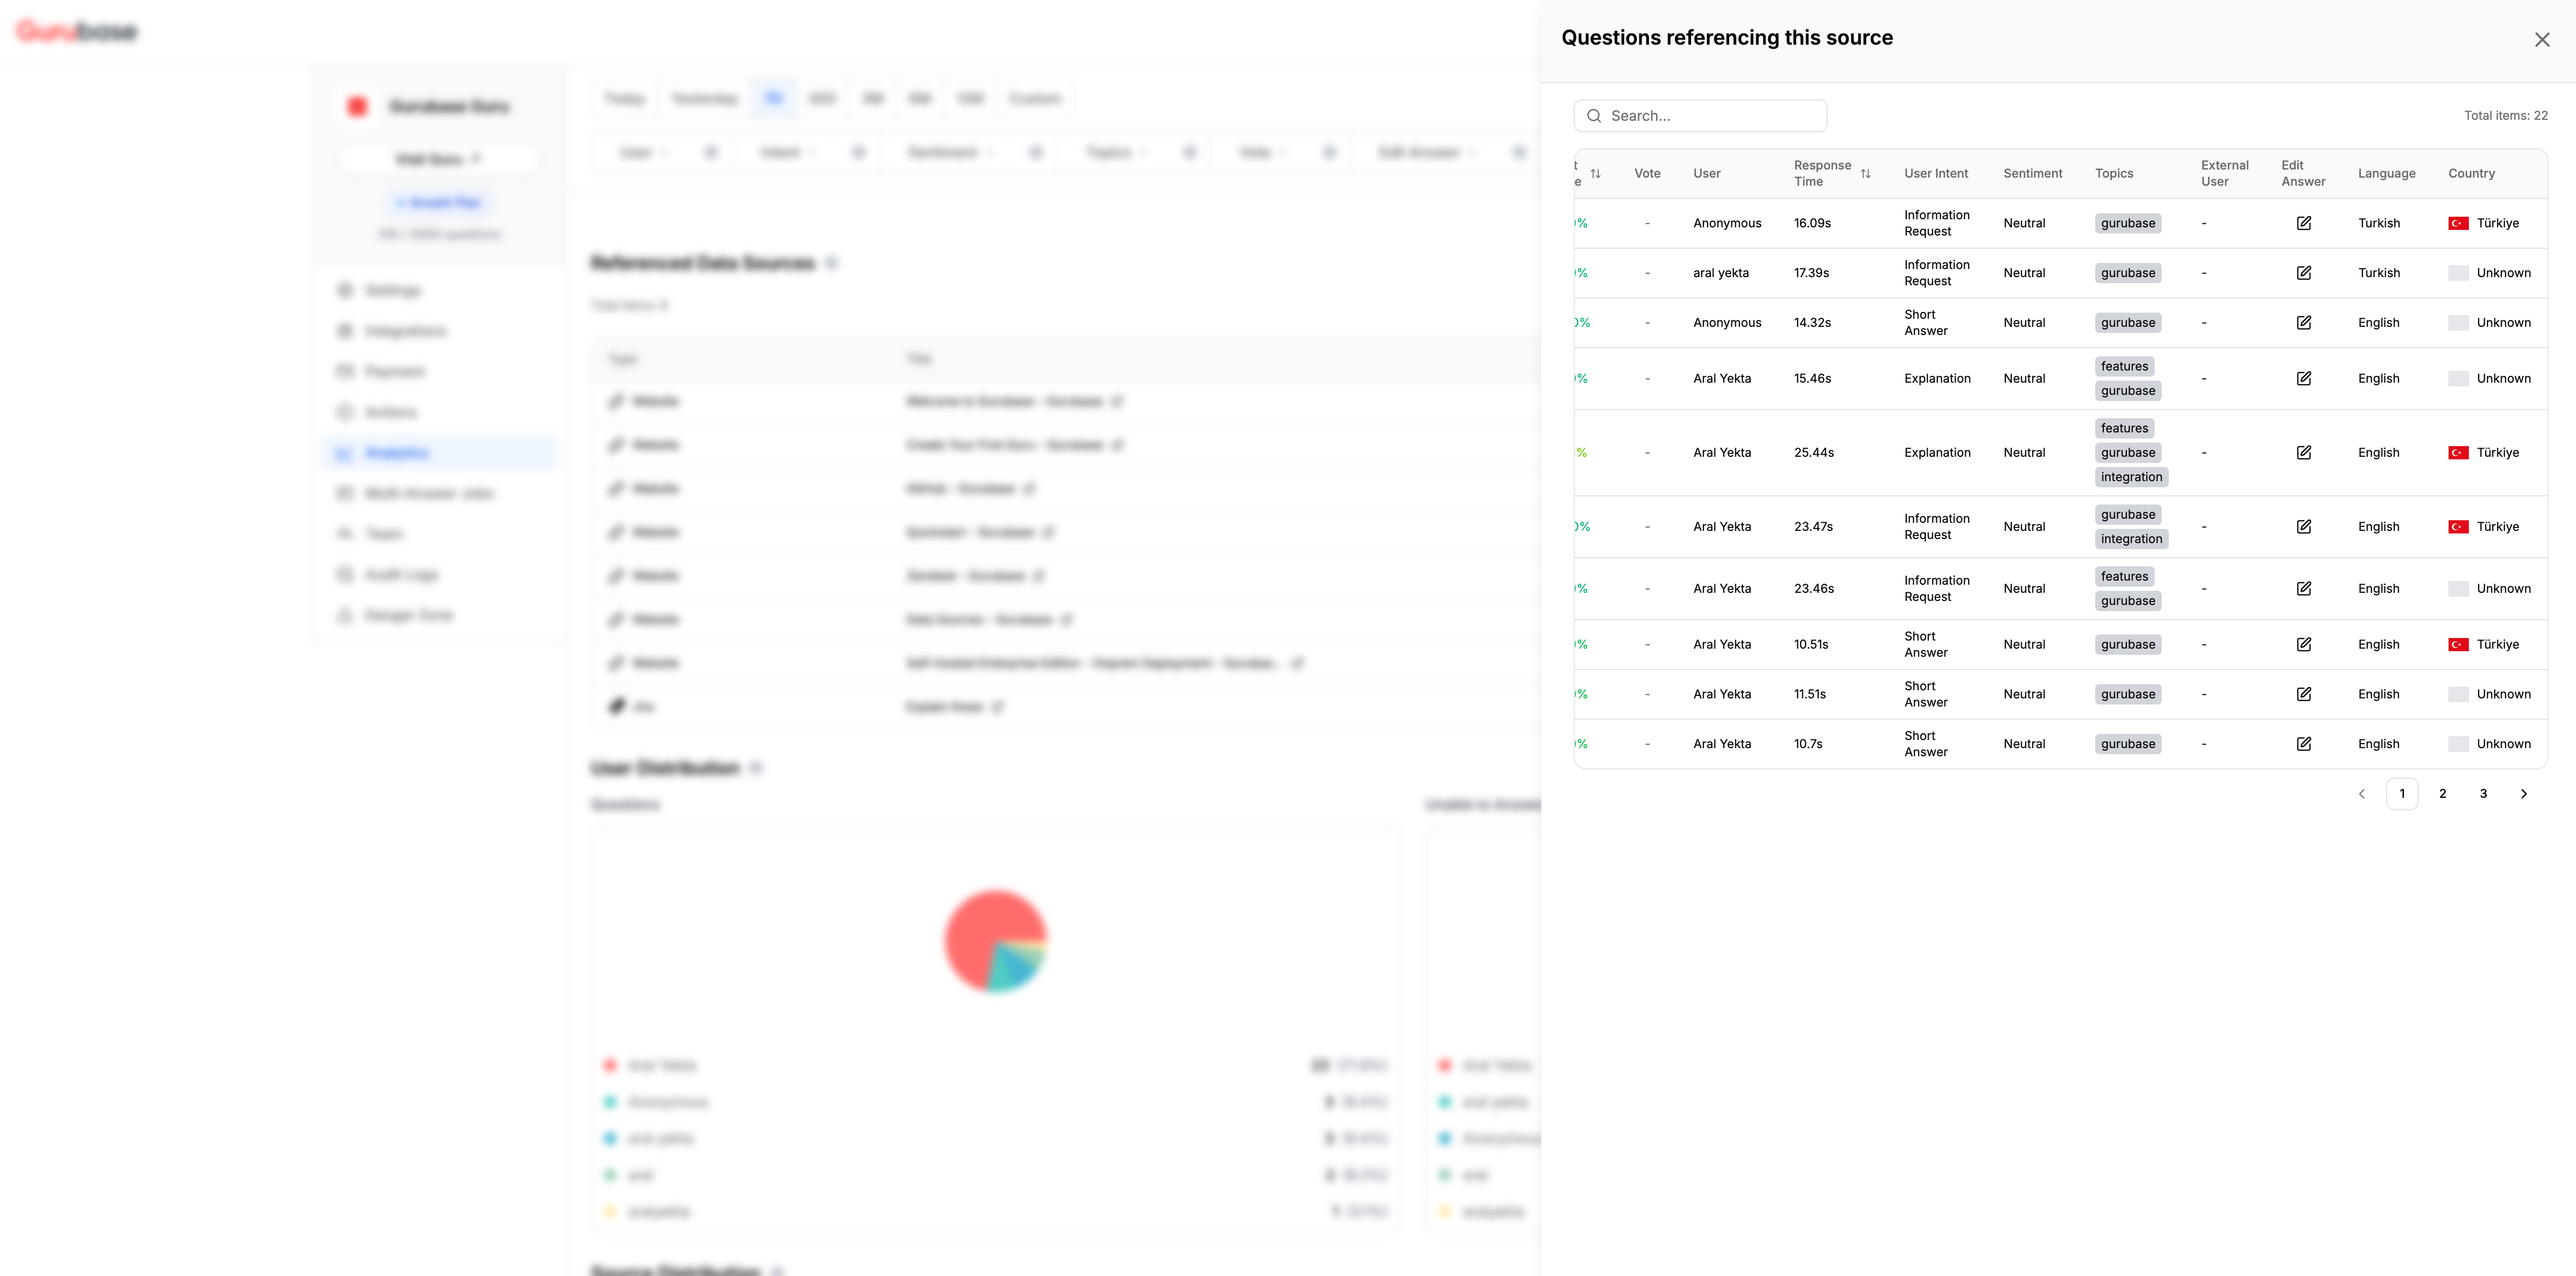
Clicking on a data source opens a modal showing all questions that referenced that source, along with detailed information about each question.
The referenced data sources section shows the data sources that your Guru has used to answer questions. The "Referenced" column shows the number of times each data source has been referenced to answer questions.
Clicking on a data source opens a modal showing all questions that referenced that source, along with detailed information about each question.
 ### 4. User Distribution
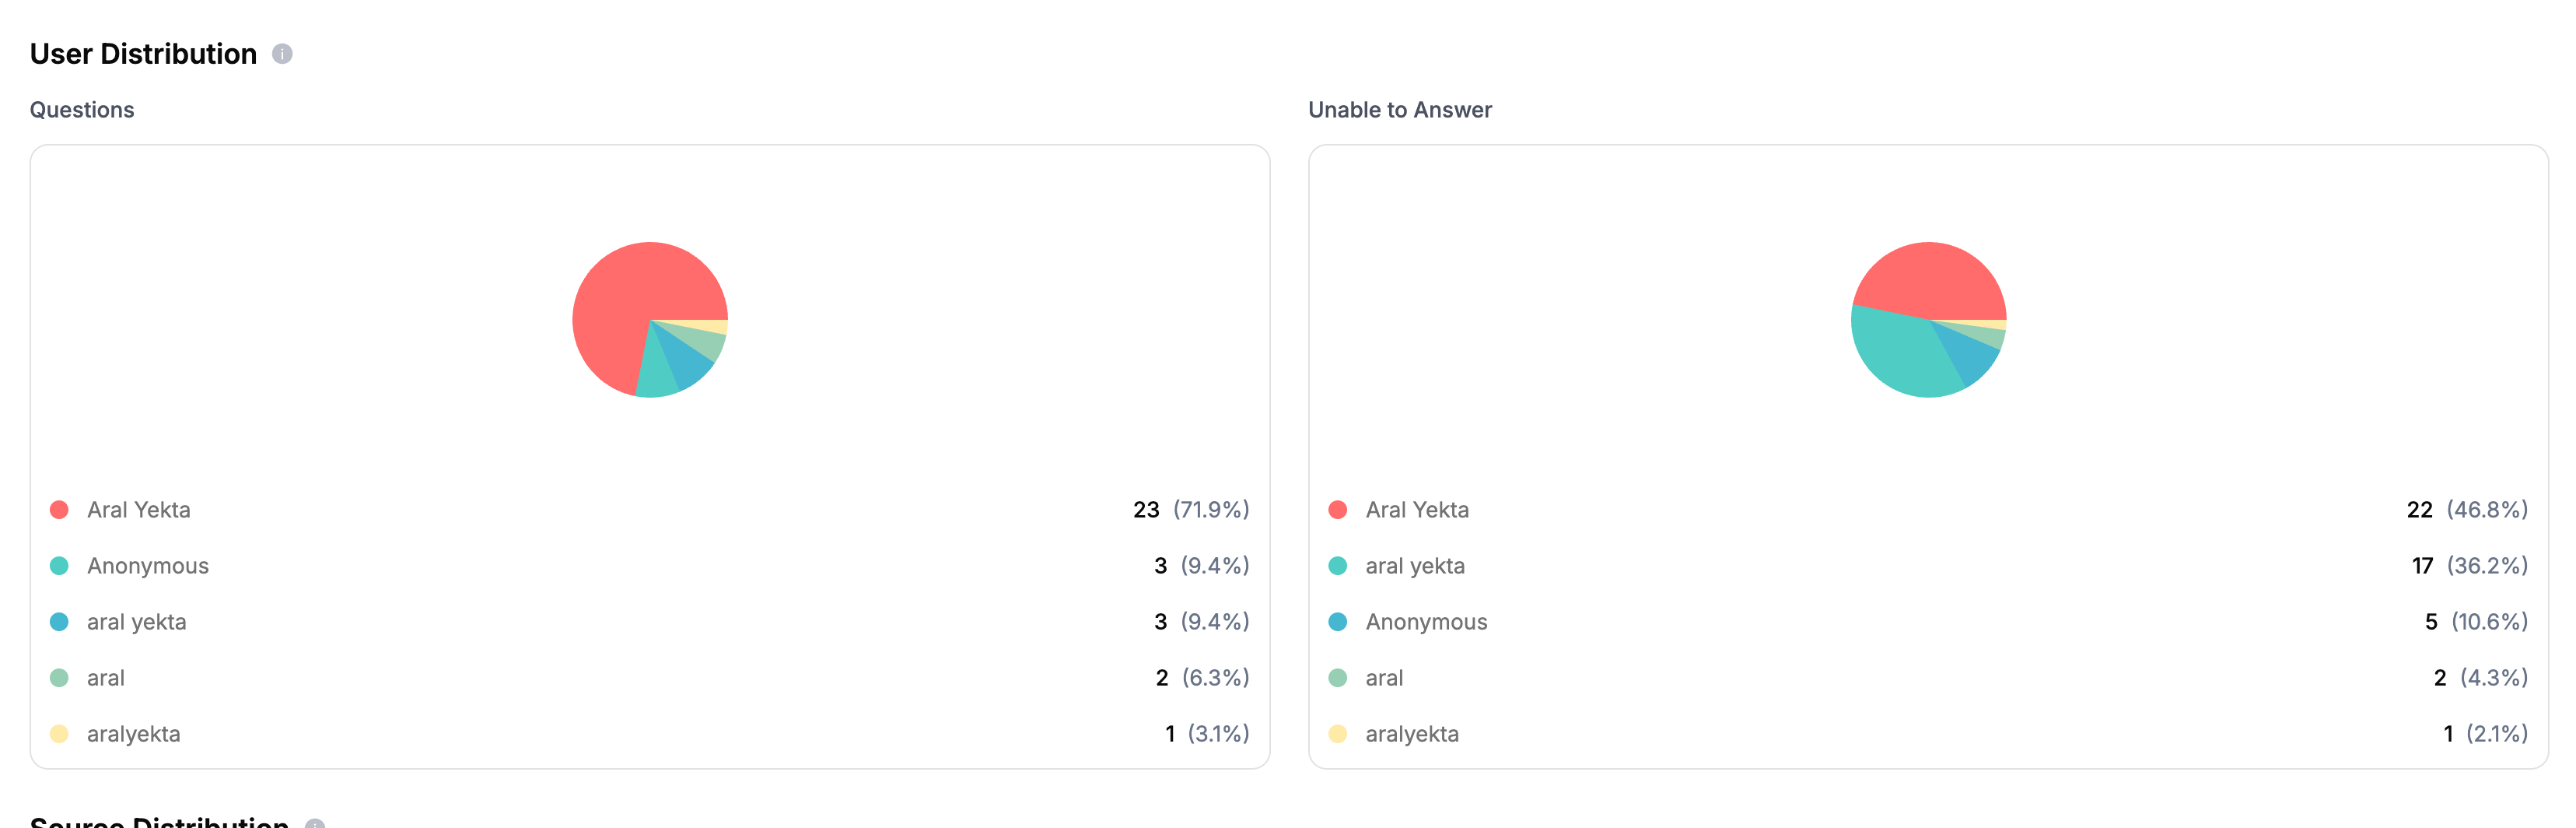 The user distribution section shows how questions are distributed among users. It displays two pie charts:
* **Questions**: Distribution of all questions by user
* **Unable to Answer**: Distribution of unanswered questions by user
This helps you understand which users are most active and identify patterns in question distribution.
### 5. External User Distribution
The external user distribution section mirrors User Distribution but buckets questions by `external_user_id` (set when asking via the API or widget with an external user identifier). Questions without an external user id are excluded. It displays two pie charts:
* **Questions**: Distribution of all questions by external user
* **Unable to Answer**: Distribution of unanswered questions by external user
Use this to see which end users of your integrations are driving question volume.
### 6. Source Distribution
The user distribution section shows how questions are distributed among users. It displays two pie charts:
* **Questions**: Distribution of all questions by user
* **Unable to Answer**: Distribution of unanswered questions by user
This helps you understand which users are most active and identify patterns in question distribution.
### 5. External User Distribution
The external user distribution section mirrors User Distribution but buckets questions by `external_user_id` (set when asking via the API or widget with an external user identifier). Questions without an external user id are excluded. It displays two pie charts:
* **Questions**: Distribution of all questions by external user
* **Unable to Answer**: Distribution of unanswered questions by external user
Use this to see which end users of your integrations are driving question volume.
### 6. Source Distribution
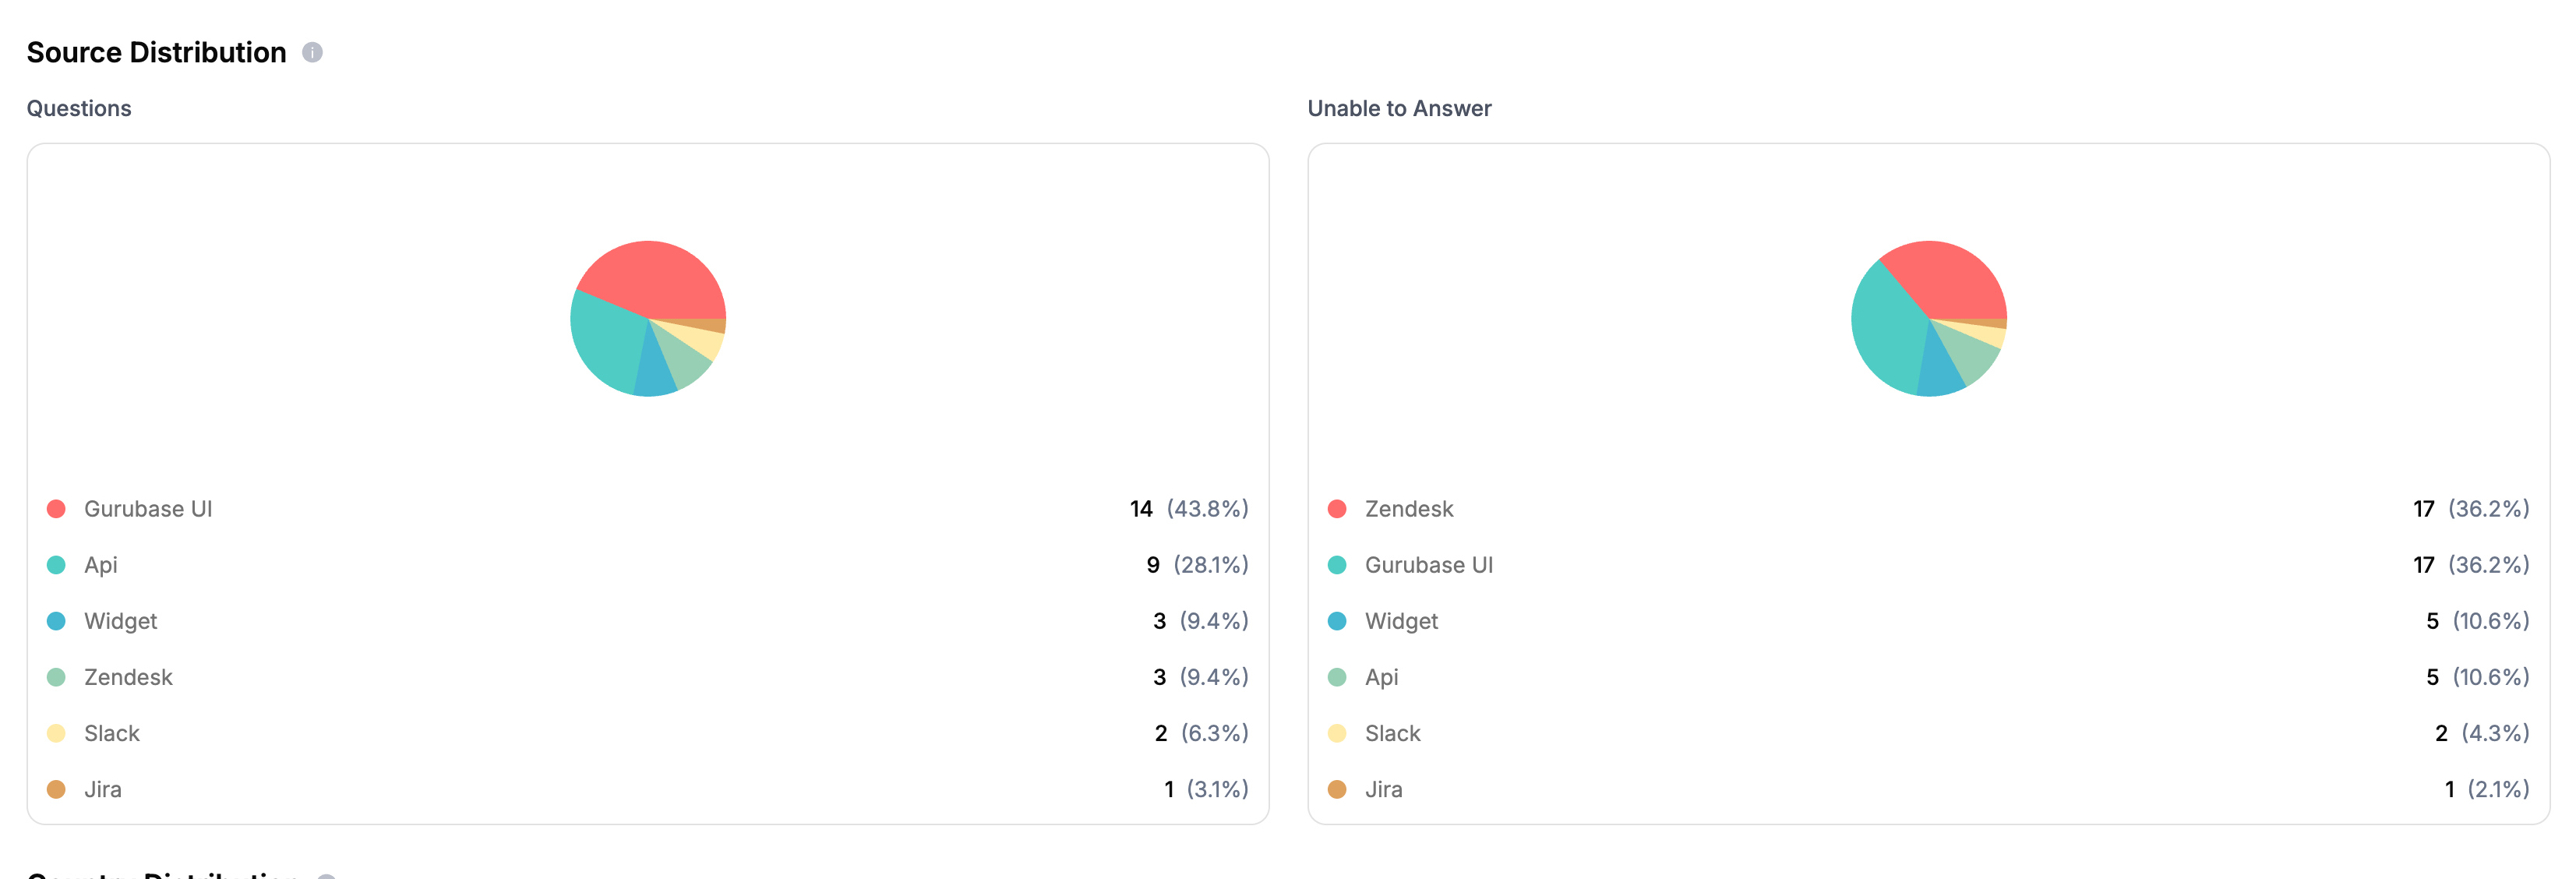 The source distribution section shows where questions are coming from. It displays two pie charts:
* **Questions**: Distribution of all questions by source (Slack, Discord, GitHub, Widget, API, Gurubase UI, Zendesk, etc.)
* **Unable to Answer**: Distribution of unanswered questions by source
This helps you understand which channels are most popular and where users are experiencing issues.
### 7. Country Distribution
The source distribution section shows where questions are coming from. It displays two pie charts:
* **Questions**: Distribution of all questions by source (Slack, Discord, GitHub, Widget, API, Gurubase UI, Zendesk, etc.)
* **Unable to Answer**: Distribution of unanswered questions by source
This helps you understand which channels are most popular and where users are experiencing issues.
### 7. Country Distribution
 The country distribution section shows the geographic distribution of questions. It displays two horizontal bar charts:
* **Questions**: Distribution of all questions by country
* **Unable to Answer**: Distribution of unanswered questions by country
This helps you understand your global user base and identify regional patterns.
### 8. Topic Distribution
The country distribution section shows the geographic distribution of questions. It displays two horizontal bar charts:
* **Questions**: Distribution of all questions by country
* **Unable to Answer**: Distribution of unanswered questions by country
This helps you understand your global user base and identify regional patterns.
### 8. Topic Distribution
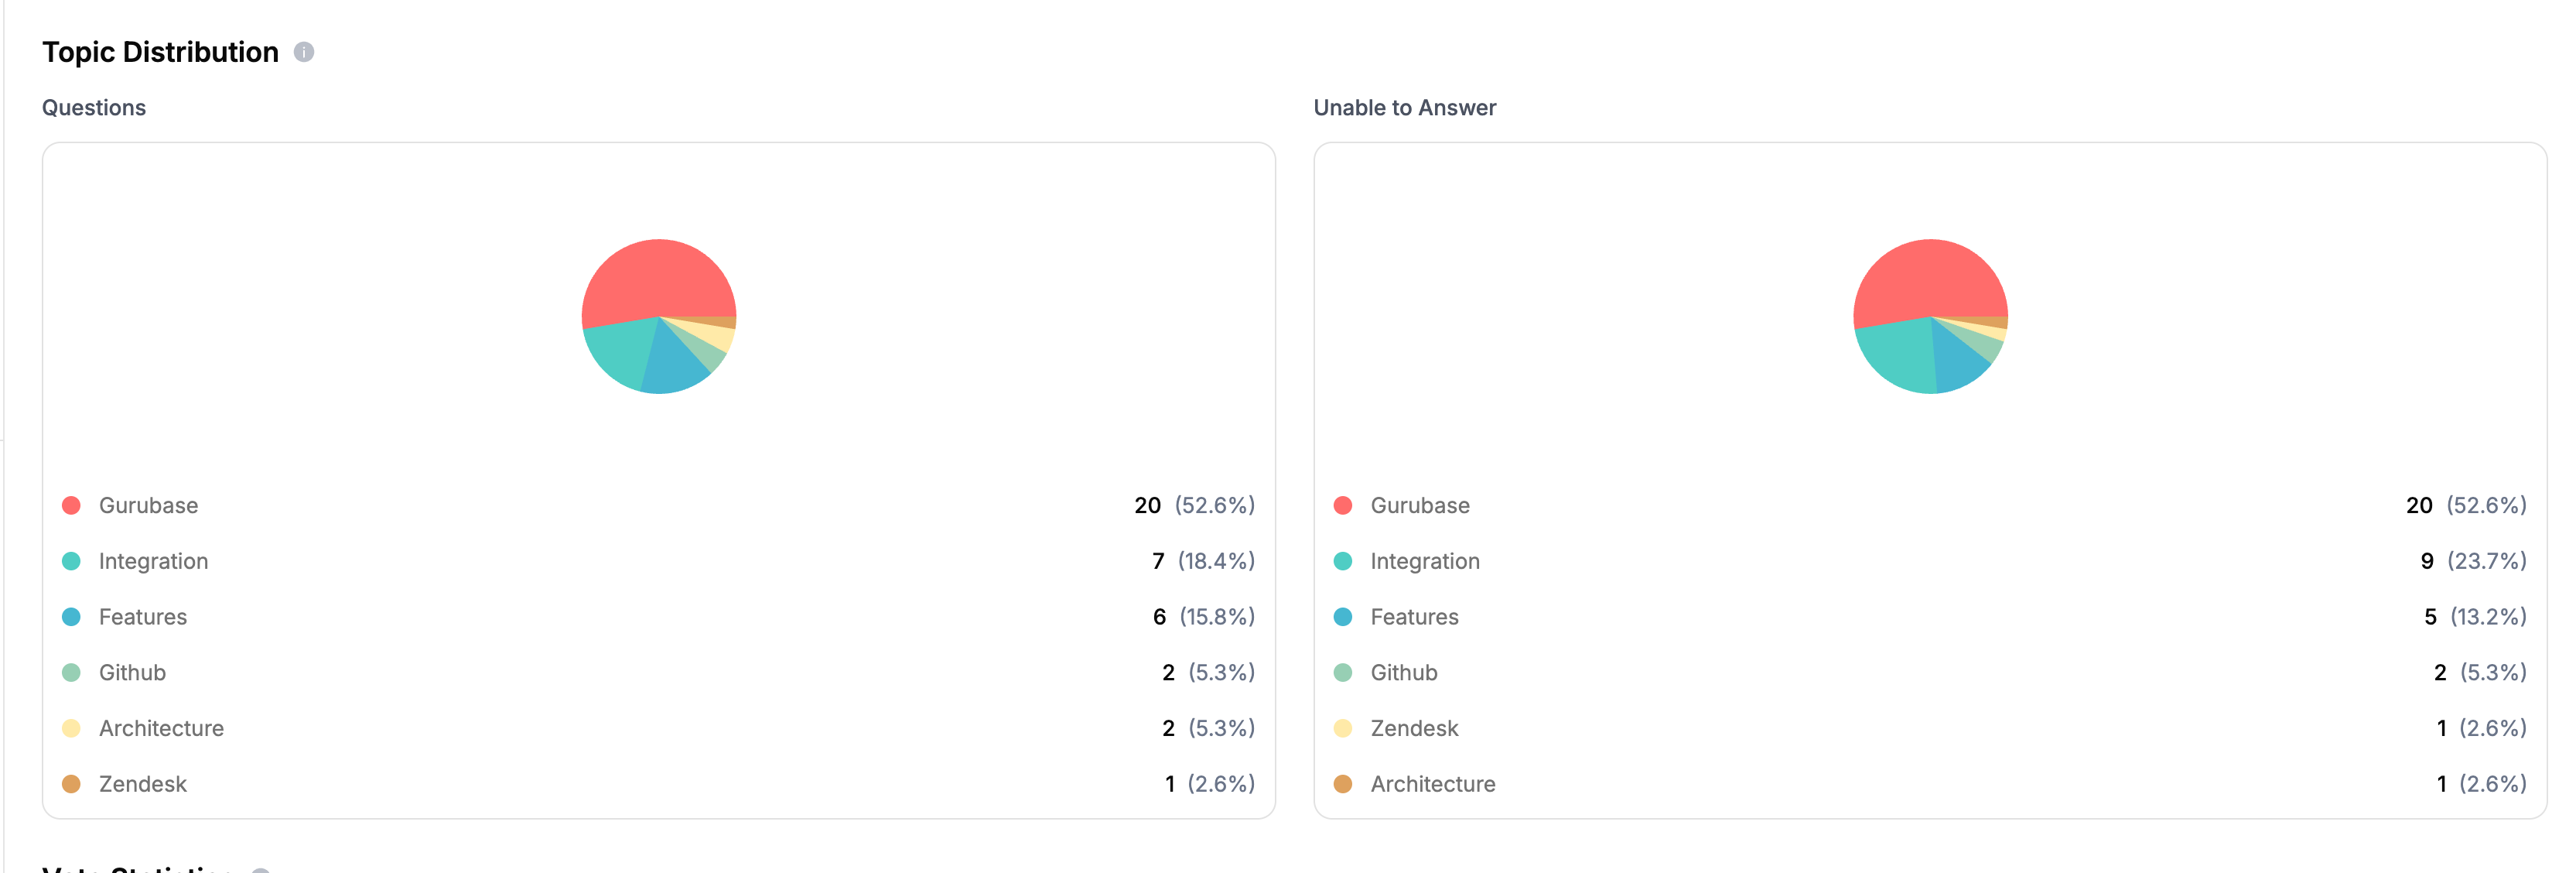 The topic distribution section shows the most common topics in questions. It displays two pie charts:
* **Questions**: Distribution of all questions by topic
* **Unable to Answer**: Distribution of unanswered questions by topic
This helps you understand what users are most interested in and identify knowledge gaps in your data sources.
### 9. Vote Statistics
The topic distribution section shows the most common topics in questions. It displays two pie charts:
* **Questions**: Distribution of all questions by topic
* **Unable to Answer**: Distribution of unanswered questions by topic
This helps you understand what users are most interested in and identify knowledge gaps in your data sources.
### 9. Vote Statistics
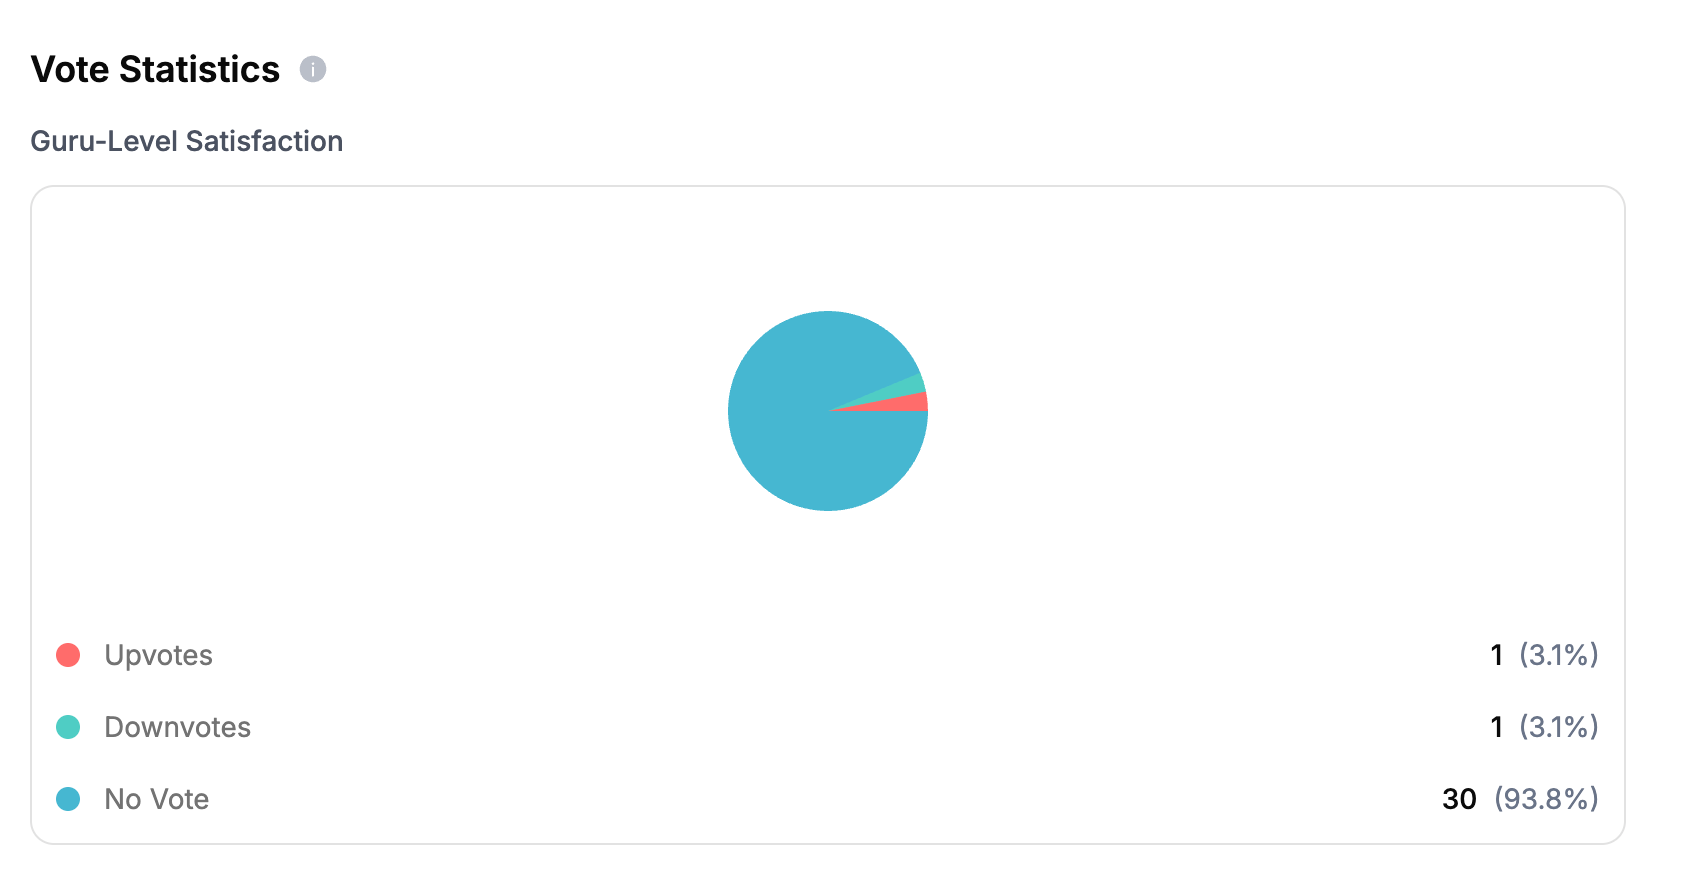 The vote statistics section shows Guru-level satisfaction through voting data. It displays a pie chart showing:
* **Upvotes**: Questions that received positive feedback
* **Downvotes**: Questions that received negative feedback
* **No Vote**: Questions without user feedback
This provides insight into overall user satisfaction with your Guru's answers.
### 10. Average Trust Score Over Time
The vote statistics section shows Guru-level satisfaction through voting data. It displays a pie chart showing:
* **Upvotes**: Questions that received positive feedback
* **Downvotes**: Questions that received negative feedback
* **No Vote**: Questions without user feedback
This provides insight into overall user satisfaction with your Guru's answers.
### 10. Average Trust Score Over Time
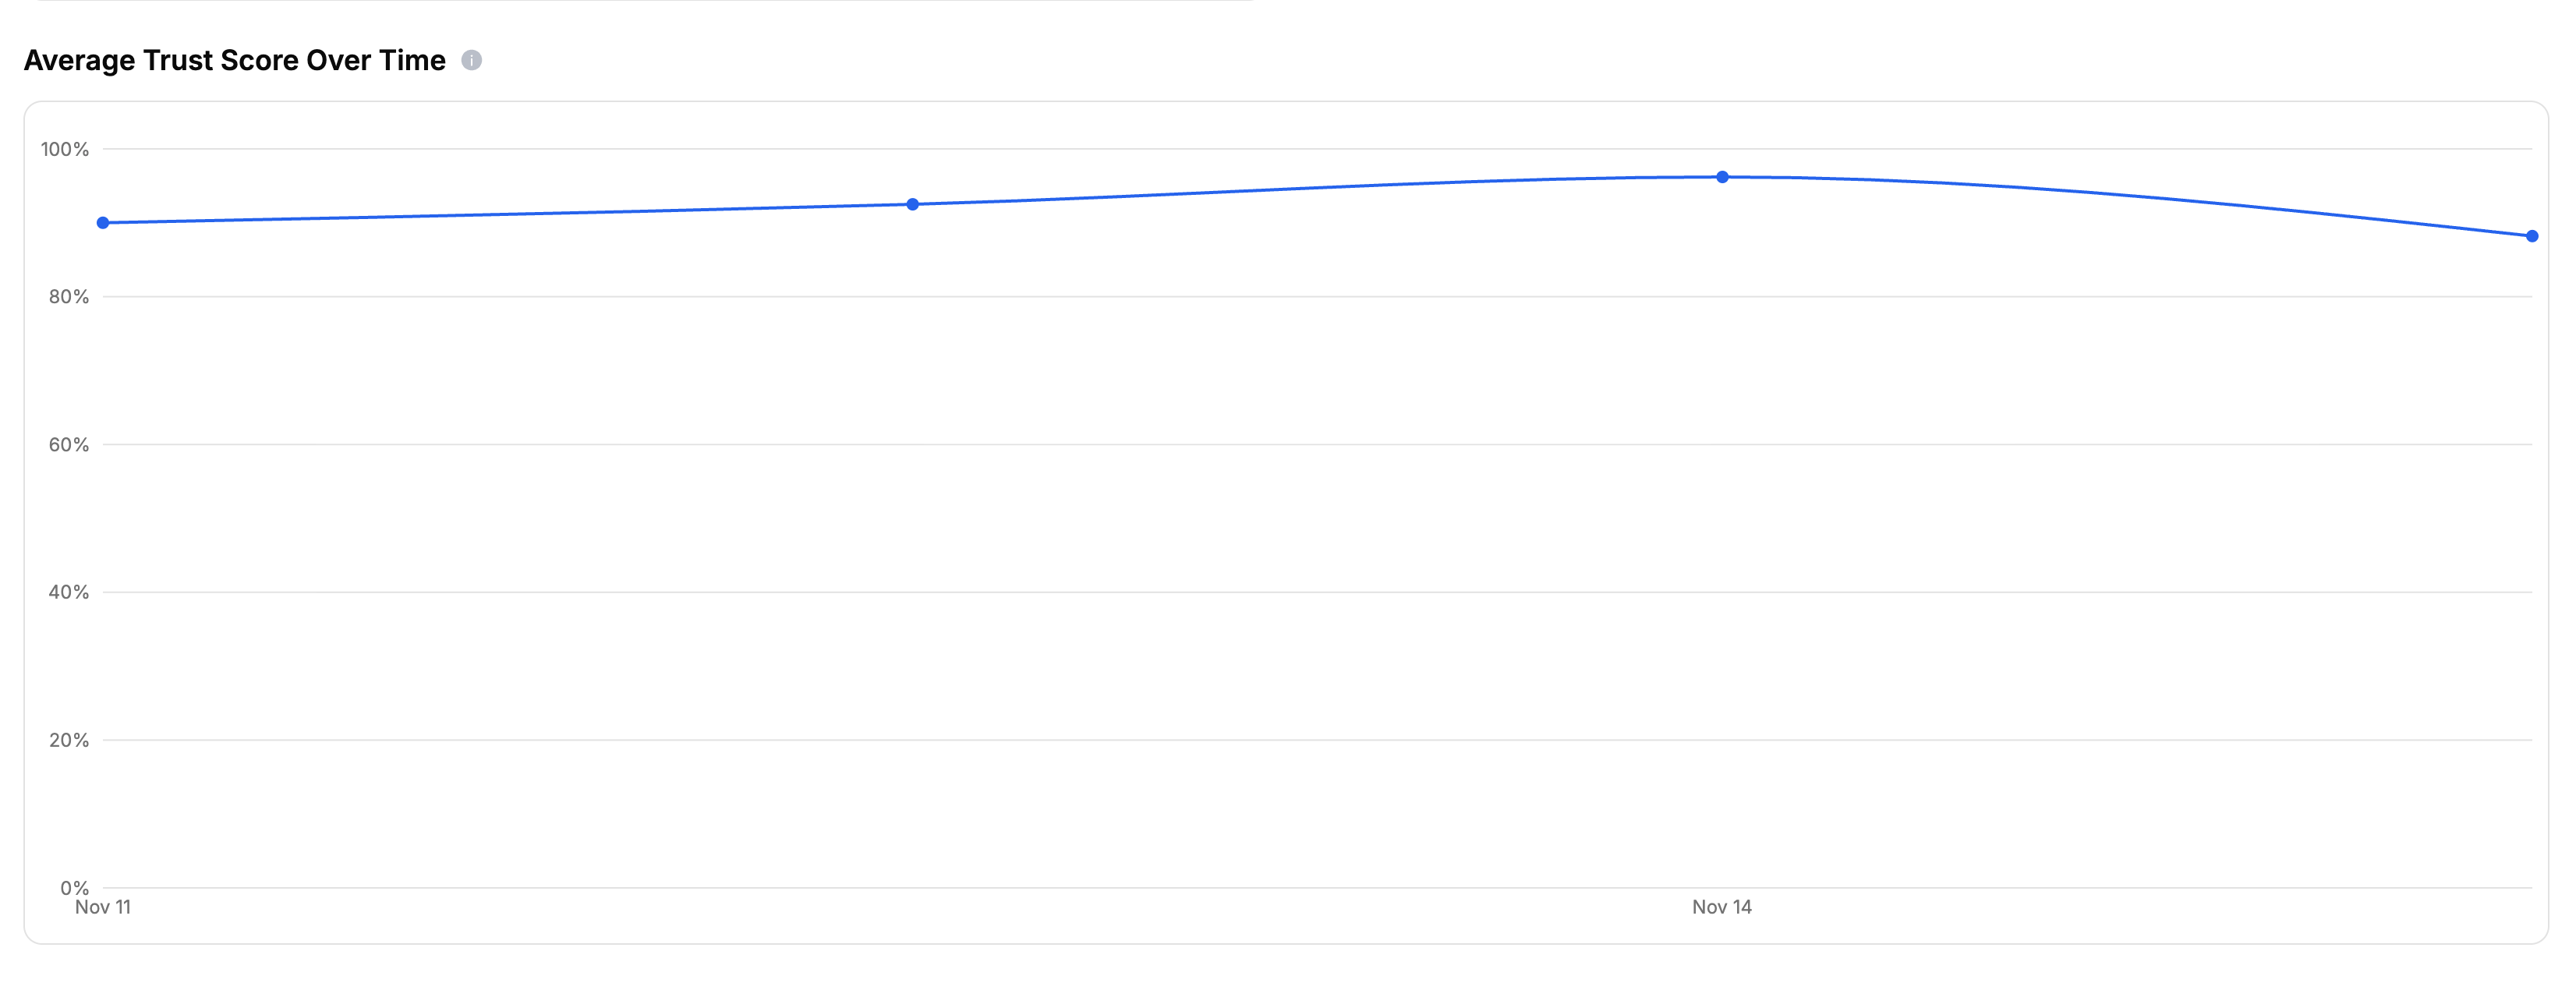 The average trust score over time section shows a line graph tracking the average confidence level of answers over the selected time period. This helps you monitor the quality and reliability of your Guru's responses over time.
### 11. Binge Length Statistics
The average trust score over time section shows a line graph tracking the average confidence level of answers over the selected time period. This helps you monitor the quality and reliability of your Guru's responses over time.
### 11. Binge Length Statistics
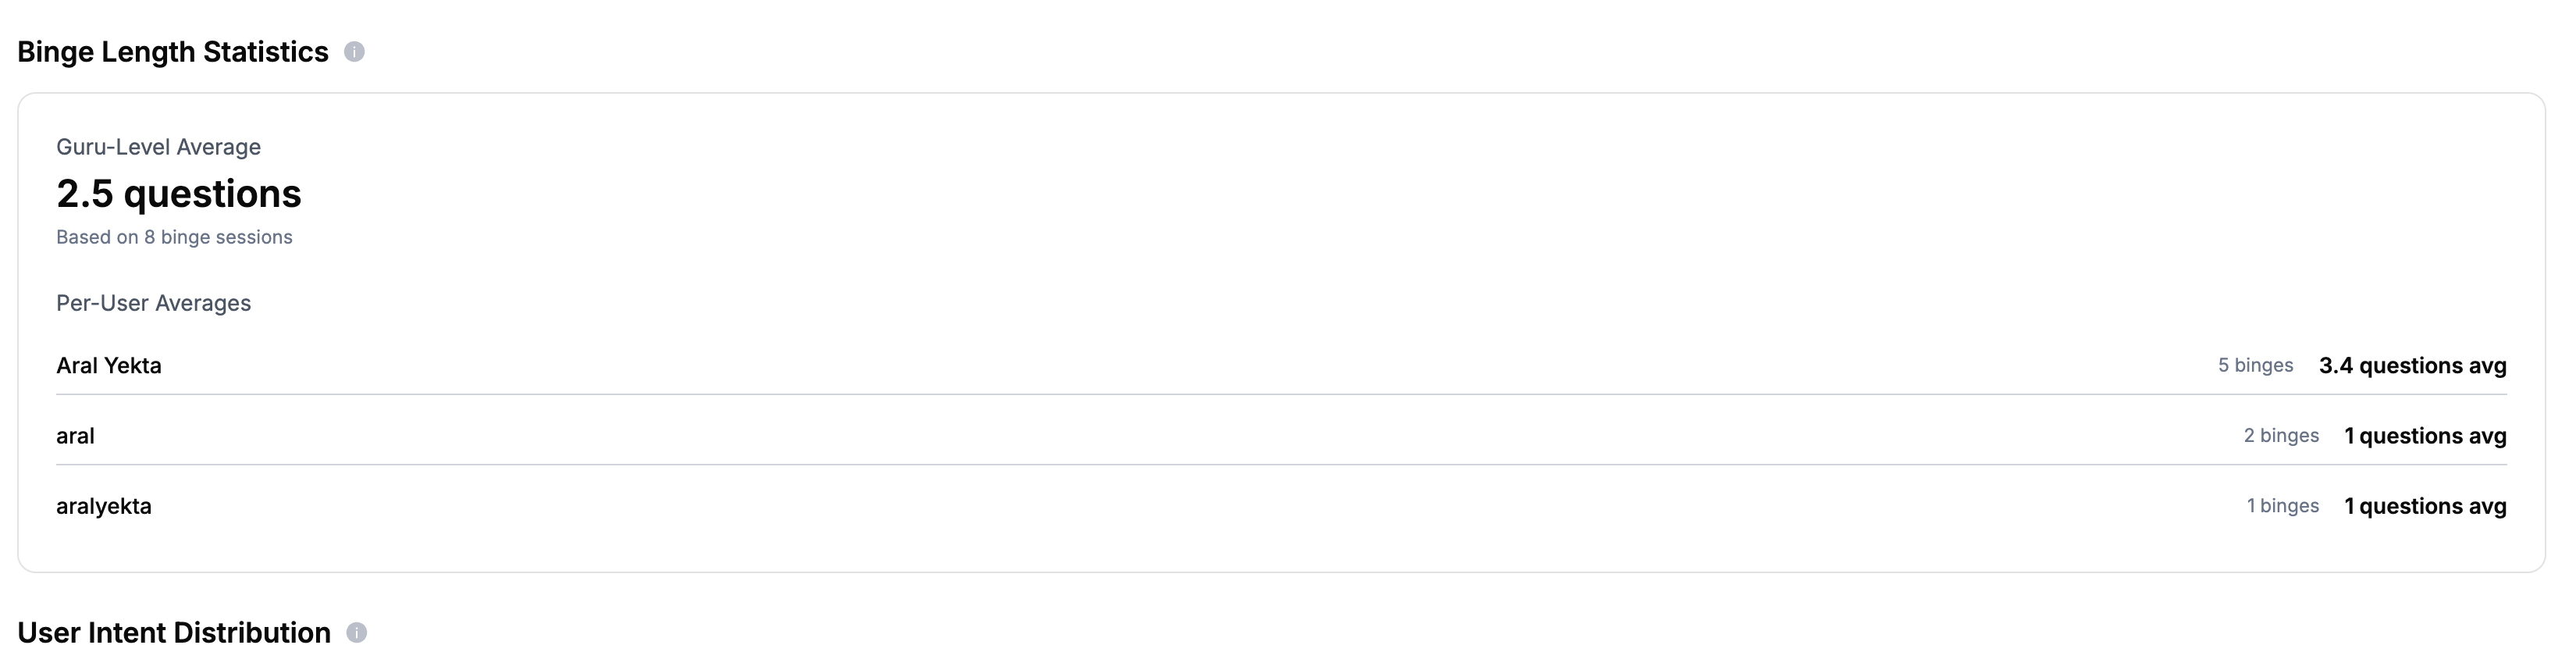 The binge length statistics section shows user engagement patterns. It displays:
* **Guru-Level Average**: Overall average number of questions per session
* **Per-User Averages**: Individual user statistics showing how many binge sessions each user had and their average questions per session
This helps you understand how engaged users are and how many questions they typically ask in a single session.
### 12. User Intent Distribution
The binge length statistics section shows user engagement patterns. It displays:
* **Guru-Level Average**: Overall average number of questions per session
* **Per-User Averages**: Individual user statistics showing how many binge sessions each user had and their average questions per session
This helps you understand how engaged users are and how many questions they typically ask in a single session.
### 12. User Intent Distribution
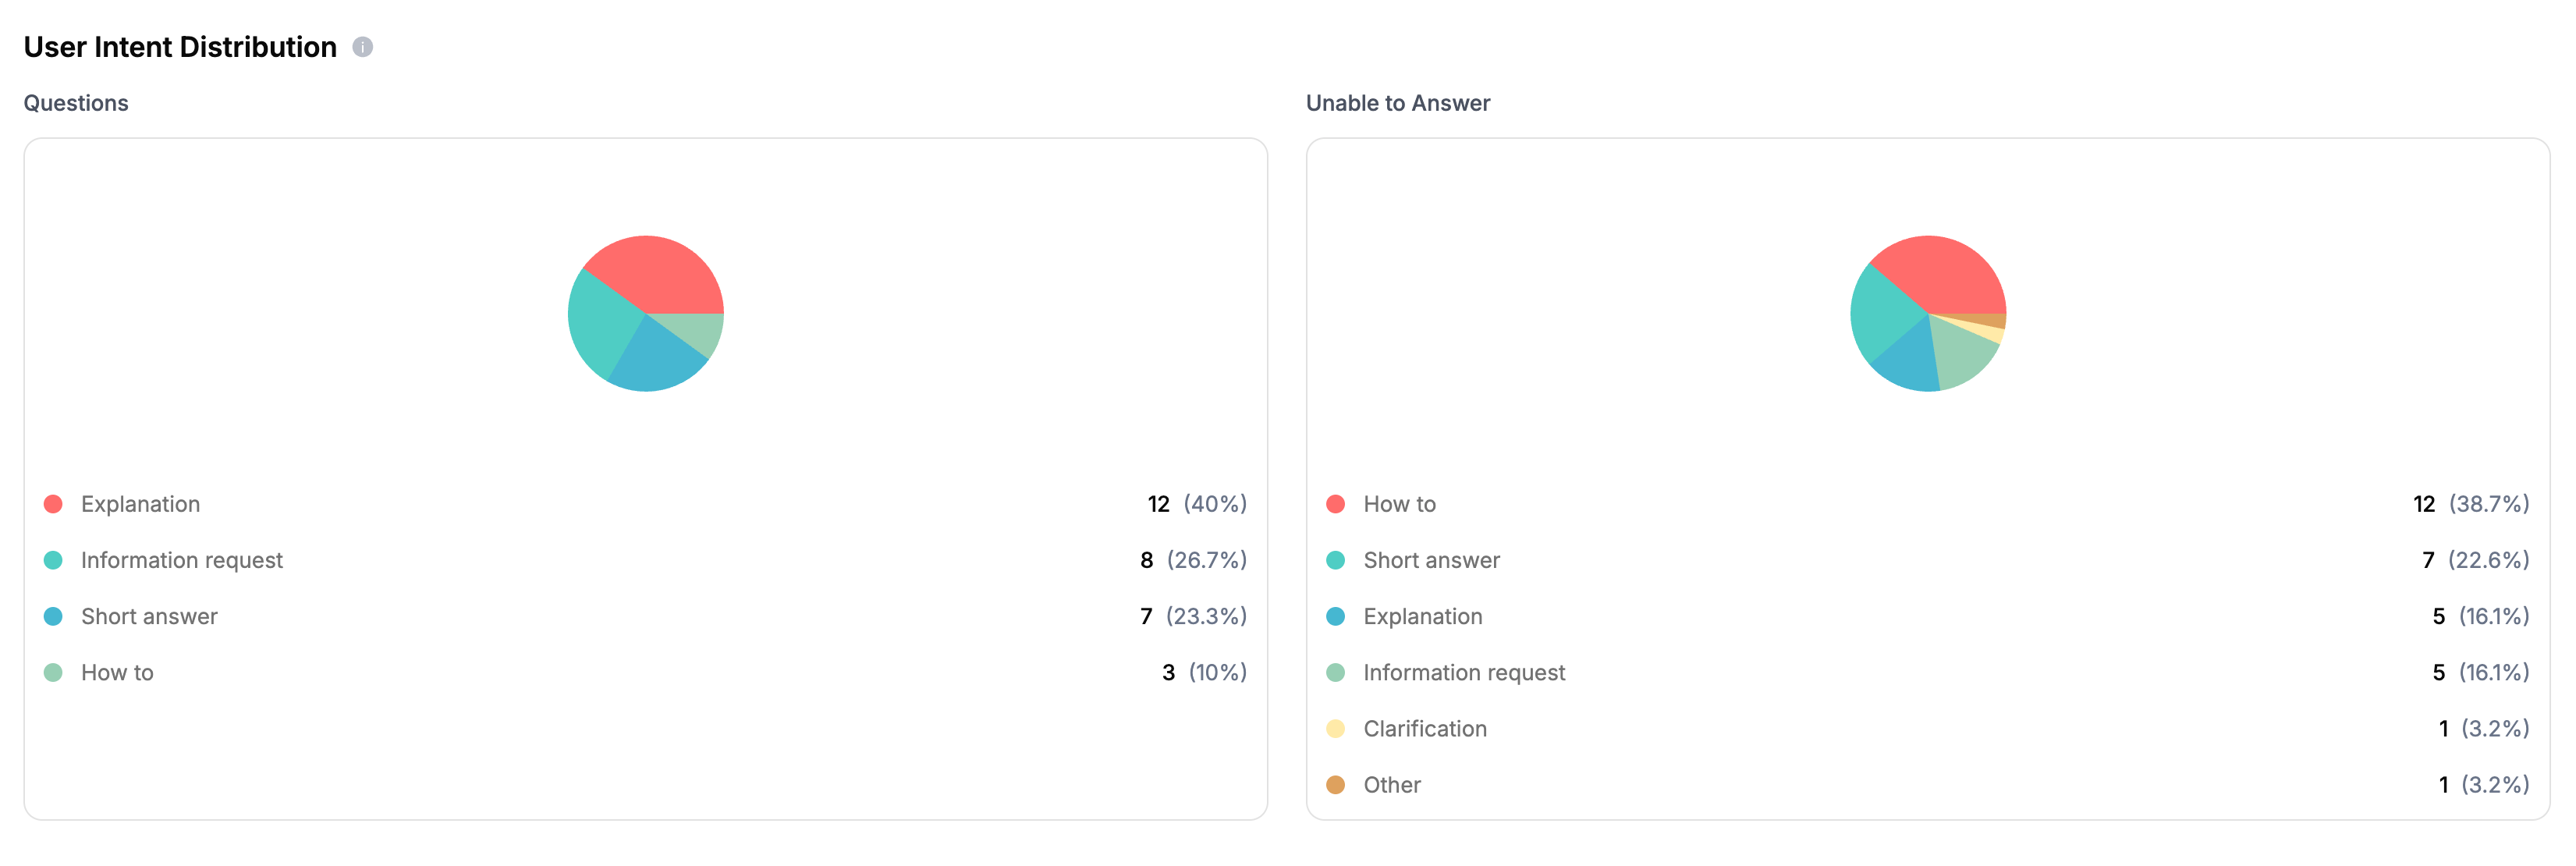 The user intent distribution section shows the types of questions users are asking. It displays two pie charts:
* **Questions**: Distribution of all questions by intent
* **Unable to Answer**: Distribution of unanswered questions by intent
The intent types include:
* **Short Answer**: User wants a brief, concise answer
* **Explanation**: User wants detailed explanation of a concept
* **How To**: User wants step-by-step instructions
* **Why**: User wants to understand reasons or causes
* **Comparison**: User wants to compare different options
* **Clarification**: User needs clarification on something unclear
* **Greeting**: User is greeting or starting conversation
* **Thanks**: User is expressing gratitude
* **Troubleshooting**: User is trying to solve a problem
* **Information Request**: User wants specific information
* **Other**: Any other intent not covered above
This helps you understand what users are trying to accomplish and identify areas where your Guru might need improvement.
### 13. Sentiment Analysis
The user intent distribution section shows the types of questions users are asking. It displays two pie charts:
* **Questions**: Distribution of all questions by intent
* **Unable to Answer**: Distribution of unanswered questions by intent
The intent types include:
* **Short Answer**: User wants a brief, concise answer
* **Explanation**: User wants detailed explanation of a concept
* **How To**: User wants step-by-step instructions
* **Why**: User wants to understand reasons or causes
* **Comparison**: User wants to compare different options
* **Clarification**: User needs clarification on something unclear
* **Greeting**: User is greeting or starting conversation
* **Thanks**: User is expressing gratitude
* **Troubleshooting**: User is trying to solve a problem
* **Information Request**: User wants specific information
* **Other**: Any other intent not covered above
This helps you understand what users are trying to accomplish and identify areas where your Guru might need improvement.
### 13. Sentiment Analysis
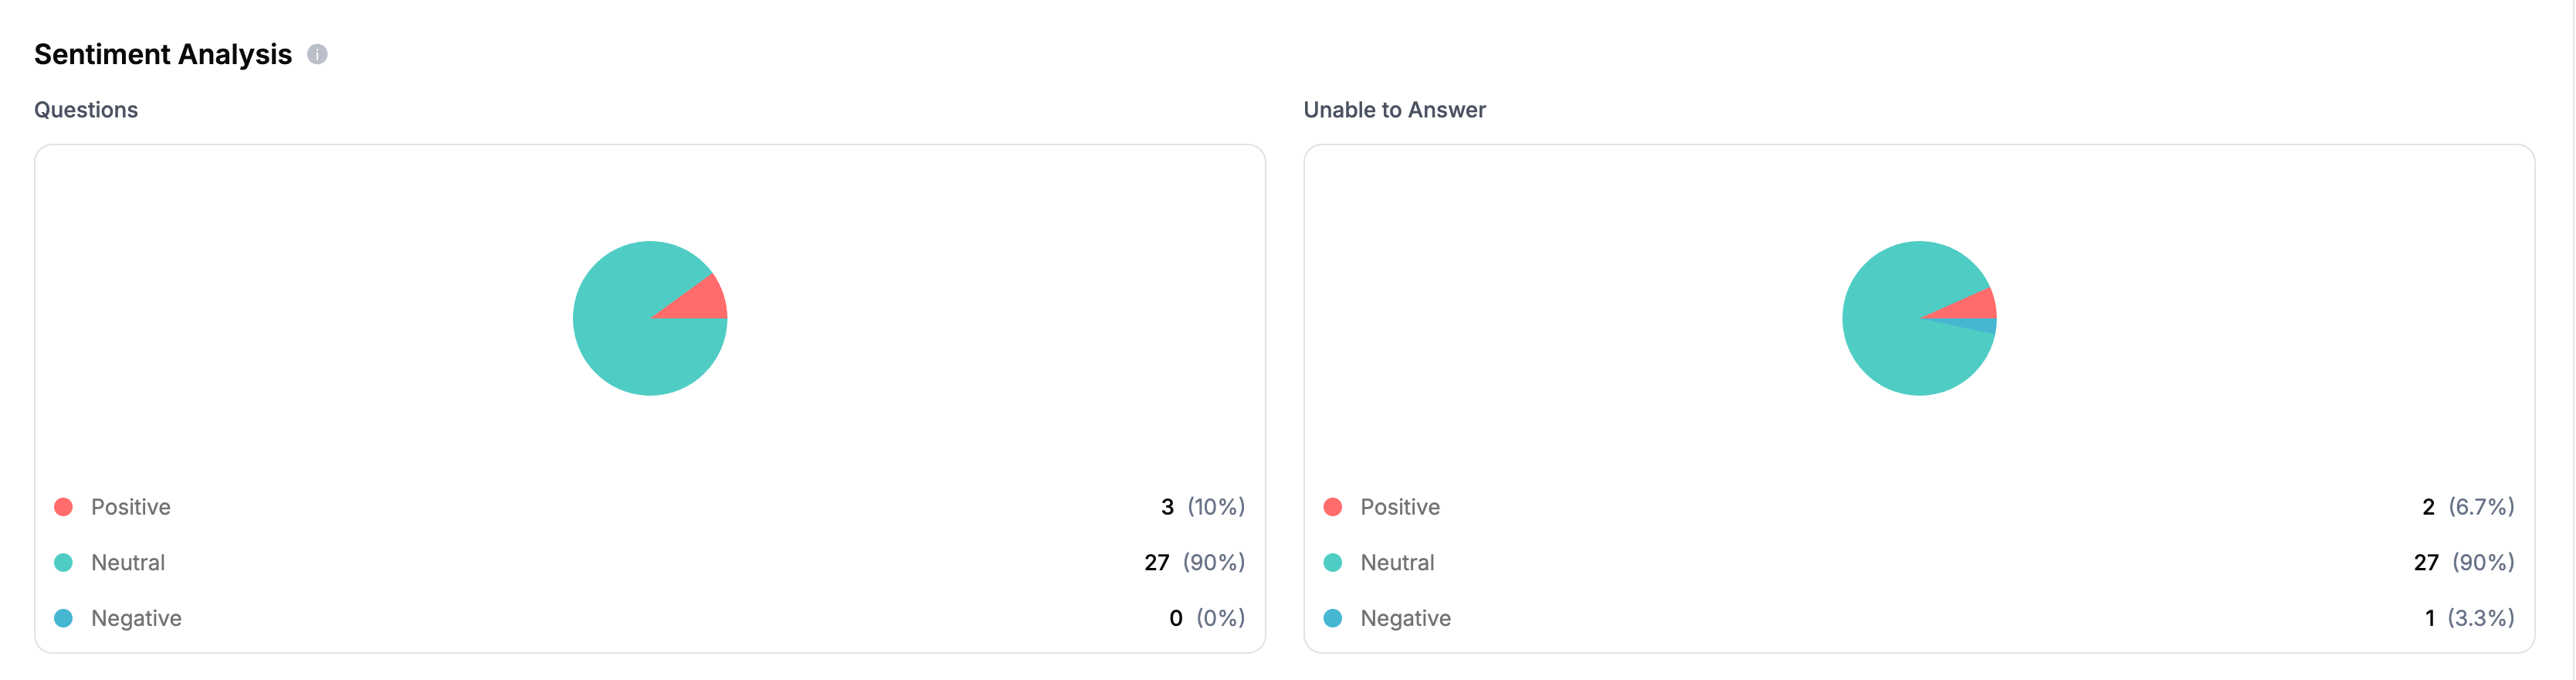 The sentiment analysis section shows the emotional tone of user questions. It displays two pie charts:
* **Questions**: Distribution of all questions by sentiment
* **Unable to Answer**: Distribution of unanswered questions by sentiment
The sentiment types include:
* **Positive**
* **Neutral**
* **Negative**
This helps you understand user satisfaction and identify potential issues that might affect user experience.
Learn how to embed your Guru on your website
Learn how to add a GitHub bot to your repositories
Learn how to add a Discord bot to your server
Integrate Guru with your applications
The sentiment analysis section shows the emotional tone of user questions. It displays two pie charts:
* **Questions**: Distribution of all questions by sentiment
* **Unable to Answer**: Distribution of unanswered questions by sentiment
The sentiment types include:
* **Positive**
* **Neutral**
* **Negative**
This helps you understand user satisfaction and identify potential issues that might affect user experience.
Learn how to embed your Guru on your website
Learn how to add a GitHub bot to your repositories
Learn how to add a Discord bot to your server
Integrate Guru with your applications